
To open long positions on EURUSD you need:
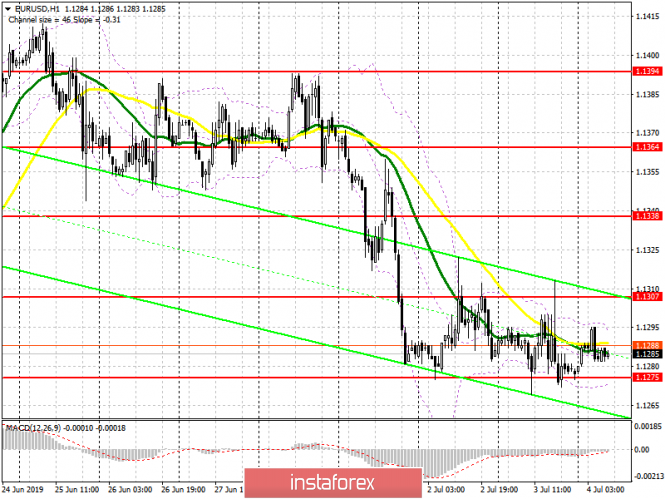
The situation has not changed in comparison with yesterday's forecast. The upward correction is still limited by the resistance of 1.1307, and for the time being, the bulls' task remains the same. A breakthrough and consolidation above this range will lead to further growth of EUR/USD along with an update of a high of 1.1338 and 1.1364, where I recommend taking profits. If the downward movement continues further, then it is best to return to long positions on a false breakdown from the support of 1.1275 or to rebound from a new monthly low around 1.1239.
To open short positions on EURUSD you need:
Further movement in the morning will depend on the report on the volume of retail trade. In case the data disappoints, another false breakout in the area of 1.1307 will be a signal to continue the downward trend, which will push EUR/USD to the area of a low of 1.1275 and will also lead to an update of a larger support of 1.1239, where I recommend taking profits. If the demand for the euro returns, then the upward potential will be limited by the resistance of 1.1338, however, it is best to open short positions to rebound immediately in the resistance area of 1.1364.
Indicator signals:
Moving averages
Trade is conducted in the region of 30 and 50 moving averages, which indicates the lateral nature of the market.
Bollinger bands
Volatility is low, which does not provide signals to enter the market.
Description of indicators
- MA (moving average) 50 days - yellow
- MA (moving average) 30 days - green
- MACD: fast EMA 12, slow EMA 26, SMA 9
- Bollinger Bands 20