
Gold price made new higher highs this week above $1,350, but at the last day of the week bulls received a bearish surprise by the market. A bearish reversal candlestick pattern in the daily chart implies that Gold has topped.
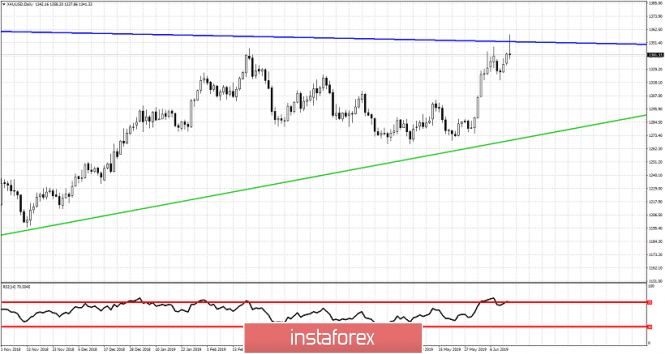
Green line - major support trend line
Gold price has reached the much anticipated $1,350-60 resistance area we have been calling for since breaking above $1,300. Friday's daily candlestick is a shooting star pattern. This is a bearish reversal pattern that implies that an important top is in and we should see Gold price pull back. Short-term support is found at $1,320. Breaking it will confirm the reversal and open the way for a move towards $1,300 if not lower. Gold price has also shown bearish divergence signs in the RSI as well. We have turned bearish Gold as the downside potential is bigger than continuing much higher.
The material has been provided by InstaForex Company - www.instaforex.com