
To open long positions on GBP/USD you need:
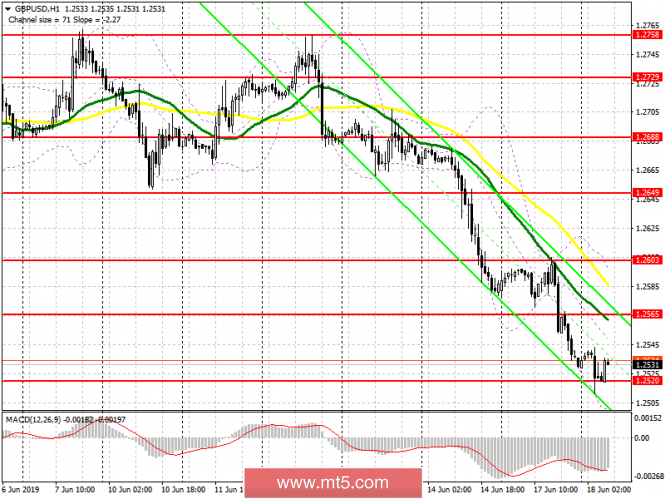
Yesterday, buyers tried to win back the divergence on MACD, but failed to keep the market on their side. At the moment, the formation of a false breakout of the support area of 1.2520 will be the signal to buy, but it is best to trade against the trend after updating larger lows around 1.2483 and 1.2439. The main task of the bulls will be a return to the resistance of 1.2565, after which it will be possible to talk about the option of a new upward correction in the pound.
To open short positions on GBP/USD you need:
The bearish trend for the pound remains. Forming a false breakdown in the resistance area of 1.2565 in the first half of the day will be a good signal to open new short positions, however, the main task of the bears will be a breakout and consolidation below the support of 1.2520, which pulls down GBP/USD and allows us to count on lows of 1.2483 and 1.2439, where I recommend to take profits. When the growth scenario is above the resistance of 1.2565, short positions can be returned to rebound from a high of 1.2603.
Indicator signals:
Moving averages
Trading is below 30 and 50 moving averages, which indicates a further decrease in the pound.
Bollinger bands
In case the pound falls, support will be provided by the lower limit of the indicator in the area of 1.2495, while growth will be limited by the upper limit in the area of 1.2585.
Description of indicators
- MA (moving average) 50 days - yellow
- MA (moving average) 30 days - green
- MACD: fast EMA 12, slow EMA 26, SMA 9
- Bollinger Bands 20