
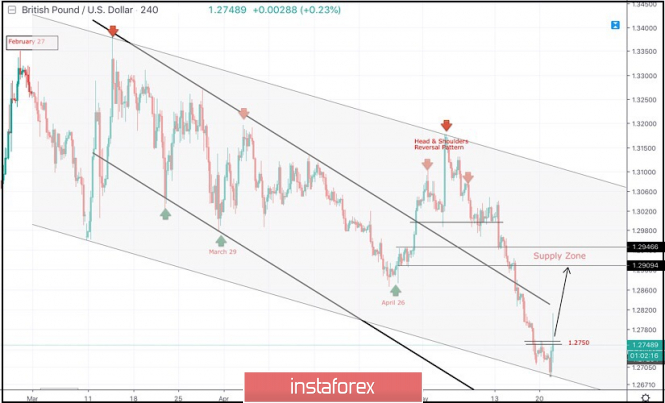
On March 29, the price levels of 1.2980 (the lower limit of the newly-established bearish movement channel) provided significant bullish support for the GBPUSD pair.
This brought the GBPUSD pair again towards the upper limit of the depicted bearish channel around (1.3160-1.3180).
Since then, Short-term outlook has turned into bearish with intermediate-term bearish targets projected towards 1.2900 and 1.2850.
On April 26, another bullish pullback was initiated towards the price levels around 1.3000 (the bottom of March 29) which has been breached to the upside until May 13 when evident bearish rejection was demonstrated.
Hence, a bearish Head and Shoulders pattern was expressed on the H4 chart with neckline located around 1.2980-1.3020.
That's why, the price zone of 1.3000-1.3020 turned to become a prominent supply-zone where a valid bearish entry was offered two weeks ago.
Bearish persistence below 1.2980 (Neckline of the reversal pattern) enhanced further bearish decline.
Initial bearish Targets were already reached around 1.2900-1.2870 (the backside of the broken channel) which failed to provide any bullish support for the pair.
Further bearish decline was demonstrated towards the lower limit of the depicted long-term channel around (1.2680-1.2700).
The GBPUSD pair looked oversold around these mentioned price levels (1.2680-1.2700) with some early signs of bullish recovery being manifested on the H4 chart.
Bullish persistence above 1.2750 is needed to enhance the bullish side of the market on the short-term. If so, initial bullish targets would be located around 1.2870-1.2900.
Trade Recommendations:
Conservative traders should wait for another bullish pullback towards 1.2870-1.2905 (newly-established supply zone) to look for valid sell entries. S/L should be placed above 1.2950.
The material has been provided by InstaForex Company - www.instaforex.com