
USD/JPY
Yesterday's turmoil in the market, caused by Trump's threat to raise duties on Chinese goods, caused the USD/JPY to decline by 78 points in the moment. As a result, the technical picture on the daily and four-hour charts has completely declined. On both charts the price is below the balance and MACD lines, the marlin oscillators in a downtrend. Apparently, the price tends to work out the line of the rising price channel (green) in the area of 110.15. For this, the price must first go below the nearest support of the red price channel (110.48). The large space at the marlin oscillator signal line on the daily chart warns of the possibility of a deeper fall in USD/JPY to support the downward channel in the area of 109.52.
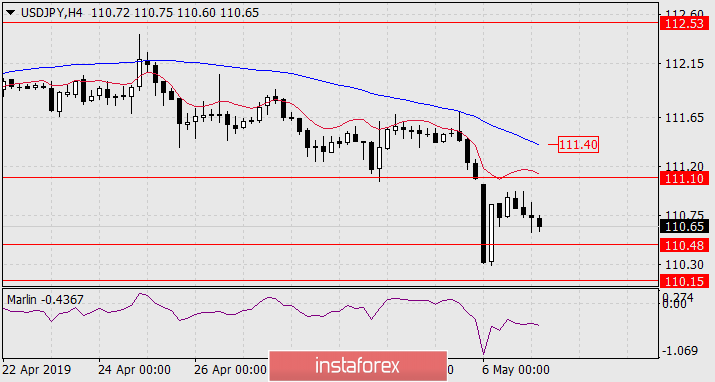

It is extremely difficult to recover the USD/JPY pair's growth. The price for this, at a low, needs to be above the MACD daily scale line (111.10), and for a certain consolidation to gain a foothold above the MACD line of four-hour scale (111.40).
The material has been provided by InstaForex Company - www.instaforex.com