
4-hour timeframe
The amplitude of the last 5 days (high-low): 51p - 31p - 77p - 41p - 42p.
Average amplitude for the last 5 days: 48p (47p).
The EUR/USD ends the second trading day of the week with a decline.
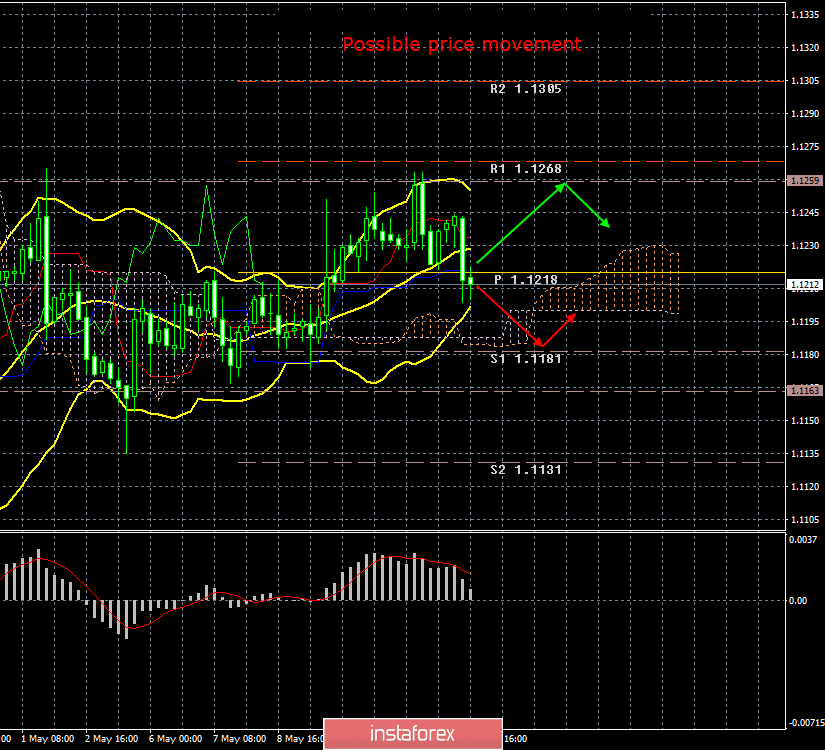
So far, this movement can be called a correction, although the pair has already overcome the critical line, which puts into great doubt the resumption of movement in the near future. There are no new messages from the White House regarding the topic of the trade war with China, although we are confident that in the near future the US President will make a statement or communicate his decision via Twitter. So far, we can state a fact: the new round of trade war that has begun is more to the hand of the US dollar than the euro. Today, in addition to everything, a report was published on industrial production in the eurozone, which showed a 0.6% y/y decrease in March. This is even higher than what experts predicted. Thus, today, the euro came under pressure from the market also due to macroeconomic data. In general, as we have repeatedly written earlier, the prospects for the euro currency remain extremely vague. The tool did not manage to go above the level of 1.1260, and also to update the previous highest price. As you can see, bulls remain extremely weak and even from a technical point of view, despite the weak, but upward trend, more preferably the resumption of the downward movement. Volatility of the pair remains rather weak. Also noteworthy are frequent intraday corrections that make it difficult to practice any movements, even in the intraday format. In general, it can still be said that the market does not have a clear trading strategy for the near future, despite the fact that the pair may now fall down to 1.1100.
Trading recommendations:
The EUR/USD pair has started to adjust. Thus, long positions can only be considered again after the reverse closure of the price above the Kijun-sen line with a target of 1.1259.
Sell positions are recommended to be considered with the first target at a support level of 1.1181 in small lots, since the bears managed to consolidate below the critical line. Now the trend has every chance to change into a downward one.
In addition to the technical picture, you should also take into account the fundamental data and the time of their release.
Explanation of the illustration:
Ichimoku indicator:
Tenkan-sen - the red line.
Kijun-sen - the blue line.
Senkou Span A - light brown dotted line.
Senkou Span B - light purple dotted line.
Chikou Span - green line.
Bollinger Bands indicator:
3 yellow lines.
MACD Indicator:
Red line and histogram with white bars in the indicator window.
The material has been provided by InstaForex Company - www.instaforex.com