MG Network
something big isHappening!
In the mean time you can connect with us with via:
- 981-981-9811
- Empire Damansara, Jln PJU 8/8A, Damansara Perdana
- info@moneygrows.net
Copyright ©
Money Grows Network | Theme By Gooyaabi Templates
Money Grows Network
Archive
- ► 2021 (6029)
- ► 2020 (6116)
-
▼
2019
(9411)
-
▼
April
(1198)
-
▼
Apr 16
(59)
- EUR/USD: focus on the euro area locomotive – Germany
- EURUSD: Euro buyers are preparing a new upward tre...
- Major currencies are stuck in a narrow range in an...
- EUR/USD, GBP/USD, GOLD. Simplified wave analysis a...
- EUR/USD: a false move down and waiting for future ...
- GBP/USD: plan for the American session on April 16...
- EUR./USD analysis for April 16, 2019
- EUR / USD plan for the US session on April 16. Eur...
- EURUSD: Euro buyers need to work hard to maintain ...
- USD/JPY analysis for April 16, 2019
- Bitcoin analysis for April 16, 2019
- Technical analysis of GBP/USD for April 16, 2019
- GBP/USD. April 16th. The trading system "Regressio...
- EUR/USD. April 16th. The trading system "Regressio...
- Technical analysis of NZD/USD for April 16, 2019
- Trading Plan for EUR / USD and GBP / USD pairs on ...
- Trading recommendations for the EURUSD currency pa...
- Investors are waiting for the recession to start a...
- Wave analysis of EUR / USD for April 16. Wave coun...
- Bitcoin. Bitcoin buyers did not hold the support l...
- Analysis of EUR/USD divergence for April 16. The e...
- Analysis of GBP/USD divergences for April 16. Poun...
- Fundamental analysis of USD/CHF for April 16, 2019
- Wave analysis of GBP / USD for April 16. Wave patt...
- Trading recommendations for the GBPUSD currency pa...
- Indicator analysis. Daily review on April 16, 2019...
- Indicator analysis. Daily review for April 16, 201...
- BITCOIN to bounce again off $5,000? April 16, 2019
- GBP/USD: plan for the European session on April 16...
- Technical analysis for Gold for April 16, 2019
- EUR/USD: plan for the European session on April 16...
- Technical analysis for EURUSD for April 16, 2019
- Forecast for GBP / USD pair on April 16, 2019
- Burning forecast 04.16.2019 EURUSD
- Forecast for GBP / USD pair on April 16, 2019
- Technical analysis of EUR/USD for 16/04/2019
- Technical analysis of GBP/USD for 16/04/2019
- Technical analysis of BTC/USD for 16/04/2019
- Technical analysis of ETH/USD for 16/04/2019
- Trading plan for EUR/USD for April 16, 2019
- Technical analysis: Important intraday Levels For ...
- Technical analysis: Important intraday levels for ...
- Forecast for AUD/USD on April 16, 2019
- Gold is heading for a mid-term decline
- Control zones GBPUSD 04/16/19
- Control zones EURUSD 04/16/19
- XAG/USD approaching support, potential bounce!
- XAG/USD approaching support, potential bounce!
- XAU/USD approaching support, potential bounce!
- Carry trade is back in fashion
- EUR/USD. April 15th. Results of the day. The trade...
- GBP/USD. April 15th. Results of the day. Today, th...
- Where will the market go in the coming days?
- GBP/USD: Three important days for the pound
- April 15, 2019 : EUR/USD Intraday technical analys...
- April 15, 2019 : GBP/USD facing a confluence of su...
- Elliott wave analysis of GBP/JPY for April 15, 2019
- Elliott wave analysis of EUR/JPY for April 15, 2019
- Weekly review of EUR / USD, GBP / USD pairs: Prepa...
-
▼
Apr 16
(59)
-
▼
April
(1198)
- ► 2018 (8656)
- ► 2017 (7162)
- ► 2016 (7614)
- ► 2015 (7602)
Powered by Blogger.
Welcome To Money Grows Network
Tags
Verified By

2006 - 2019 © www.moneygrows.net
Investments in financial products are subject to market risk. Some financial products, such as currency exchange, are highly speculative and any investment should only be done with risk capital. Prices rise and fall and past performance is no assurance of future performance. This website is an information site only.
Popular
-
GBP/USD 5M The GBP/USD pair moved much more "softly" in comparison with the jerky movements of the euro/dollar pair on Friday. T...
-
EUR/USD 5M The EUR/USD pair did not trade in the best way during the last trading day of the week. Of course, the report on inflation in t...
-
4-hour timeframe Technical details: Higher linear regression channel: direction - downward. Lower linear regression channel: direction -...
-
4-hour timeframe Technical details: Higher linear regression channel: direction - downward. Lower linear regression channel: direction -...
-
Analysis of previous deals: 30M chart of the GBP/USD pair The GBP/USD pair also resumed a not too strong upward movement on Friday. An up...
Expert In
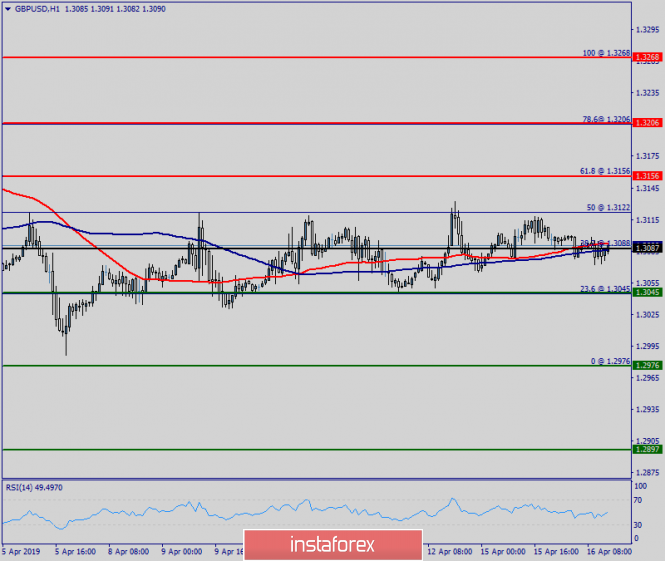
Technical analysis of GBP/USD for April 16, 2019
www.instaforex.com