
Gold's monthly chart is worrying as long as price is below $1,350-60. Gold price has made three lower highs and three rejections in the price area of $1,350-$1,370. Bulls still have hopes for a move higher as price is also making higher lows.
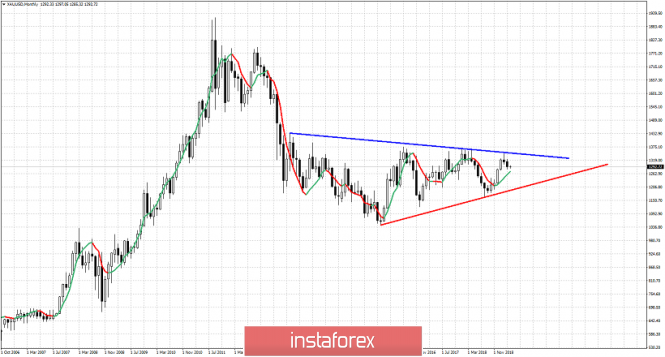
Blue line - major resistance trend line
Red line - major support trend line
Gold price reached the blue trend line resistance once again on February and got rejected. This is a bearish sign. However not all is lost for bulls as long as price remains above the red trend line support. This support is now at $1,200. We could see a deeper pull back if $1,280-90 fails to hold towards $1,200. Breaking below $1,200 on a monthly basis would open the way for a move below $1,000. On the other hand if bulls break above $1,350-60 on a monthly basis we could see a move towards $1,450-$1,500. Price is now closer to long-term resistance and stop levels for bears and the risk reward ratio favors bearish positions.
The material has been provided by InstaForex Company - www.instaforex.com