
Gold price tried to break above short-term resistance yesterday but instead it got rejected. Not only were the bulls unable to break resistance, price has broken through the short-term support together with the RSI. It seems that new selling pressure could start again for the next leg down to $1,250.
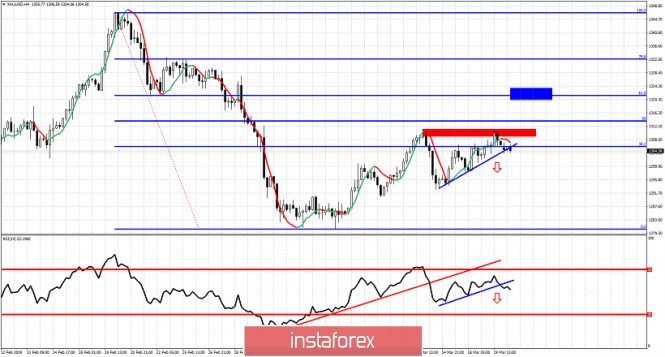
Blue rectangle - target if short-term resistance is broken
Blue lines - short-term support trend lines
Red line - RSI support trend line broken
Gold price has broken below the blue upward sloping support trend line. This is a bearish sign. However price is still above $1,300 and this implies that bulls have not given up yet. The RSI is also showing reversal signs. Gold bulls should hold above $1,300 and especially above $1,292. Breaking below $1,292 will increase dramatically the chances for a move towards $1,250-60. Only a break above $1,312 will bring bulls back in control of the short-term trend. Until then bears can still hope for a new round of selling pressure.
The material has been provided by InstaForex Company - www.instaforex.com