
Gold price has reached as high as $1,311 and is now pulling back towards $1,300. Short-term trend remains bullish as long as price is above $1,300 and inside the bullish short-term channel. Gold price is likely to move downwards to $1,250-60, and a break below $1,300 would increase the chances of this scenario coming true.
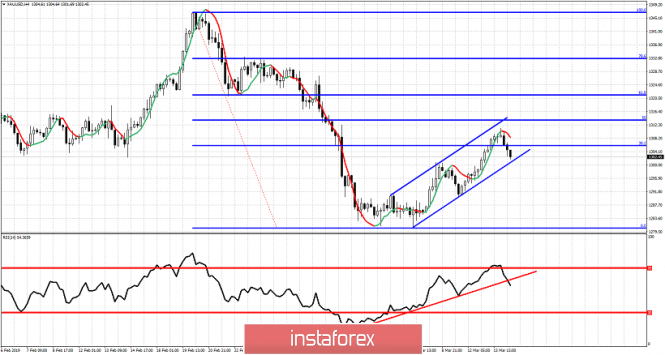
Red line - RSI trend line support
Gold price bounced as expected towards $1,300-$1,310 area which was our initial target area for a bounce. Price remains inside the bullish channel where support is at $1,300. Price has reached the 38% Fibonacci retracement and marginally crossed above it closer to the 50% retracement. Price has reversed and the RSI is breaking below the red support trend line. This is a bearish sign. If this break of the RSI support is combined with a drop of price below $1,300, we could see another strong selling wave that would push gold price towards $1,250.
The material has been provided by InstaForex Company - www.instaforex.com