
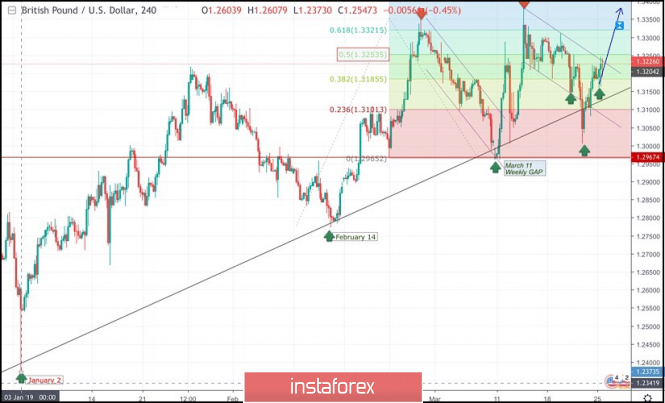
On January 2nd, the market initiated the depicted uptrend line around 1.2380.
This uptrend line managed to push price towards 1.3200 before the GBP/USD pair came to meet the uptrend again around 1.2775 on February 14.
Another bullish wave was demonstrated towards 1.3350 before the bearish pullback brought the pair towards the uptrend again on March 11.
A weekly bearish gap pushed the pair slightly below the trend line (almost reaching 1.2960) before the bullish breakout above short-term bearish channel was achieved on March 11.
Bullish persistence above 1.3060 allowed the GBPUSD pair to pursue the bullish momentum towards 1.3130, 1.3200 then 1.3360 where the recent bearish pullback was initiated.
Bullish persistence above 1.3250 ( 50% Fibonacci expansion level ) was needed for confirmation of a bullish Flag pattern. However, significant bearish pressure was demonstrated below 1.3250.
Hence, the short term outlook turned to become bearish towards 1.3120 - 1.3100 where the depicted uptrend line failed to provide any immediate bullish support.
Bearish breakout below 1.3100 (23.6% Fibonacci level) allowed quick bearish decline towards 1.3000 where the current bullish momentum that brought the pair back above 1.3200 was initiated (False bearish breakout).
Today, The price level around 1.3250 ( 50% Fibonacci expansion level) stands as an Intraday resistance/supply level that needs to be broken to the upside for confirmation of the depicted flag pattern.
On the other hand, bearish rejection around 1.3250 may initiate bearish decline towards 1.3180 then 1.3100 thus remainin within the current consoliation range.
Trade Recommendations:
Intraday traders should wait for a bullish breakout above (1.3250) on H1 chart. Bullish projection target levels to be located around 1.3320 then 1.3420.
SL to be placed above 1.3180.
The material has been provided by InstaForex Company - www.instaforex.com