
To open long positions on EURUSD you need:
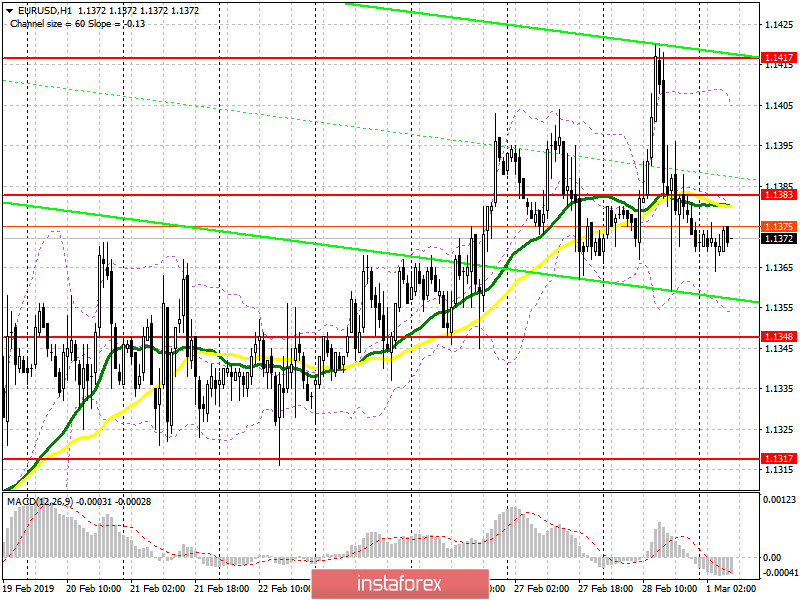
Today, buyers of the euro need to return to the resistance level of 1.1383, consolidating above which will be a signal to buy in order to update the weekly high of 1.1417, where I recommend taking profits. In the event of weak data on inflation in the eurozone, and after yesterday's reports from Italy, France and Germany, most likely it will be so, it will be best to consider new long positions in EUR/USD after updating the low of 1.1348 or a rebound from the support of 1.1317.
To open short positions on EURUSD you need:
Yesterday's data on the eurozone limited the euro's growth, and a good report on US GDP supported the US dollar. As long as trading continues below the border of 1.1383, pressure on EUR/USD will continue, and the formation of a false breakdown there, after the release of the inflation report in the eurozone, will be a direct signal to sell the euro to decline to a low of 1.1348, where I recommend taking profits. In case the euro increases above the resistance of 1.1383, after good reports, it is best to consider new short positions to rebound from the high of 1.1417 and 1.1459.
Indicator signals:
Moving averages
Trading near the 30-day and 50-day moving averages, indicates market uncertainty, with a slight advantage of sellers.
Bollinger bands
In the event of a decline, support will be provided by the lower limit of the Bollinger Bands indicator in the area of 1.1355, while the upper limit in the area of 1.1405 will act as resistance.
Description of indicators
- MA (moving average) 50 days - yellow
- MA (moving average) 30 days - green
- MACD: fast EMA 12, slow EMA 26, SMA 9
- Bollinger Bands 20