
4-hour timeframe
The amplitude of the last 5 days (high-low): 58p - 42p - 61p - 56p - 73p.
Average amplitude for the last 5 days: 58p (52p).
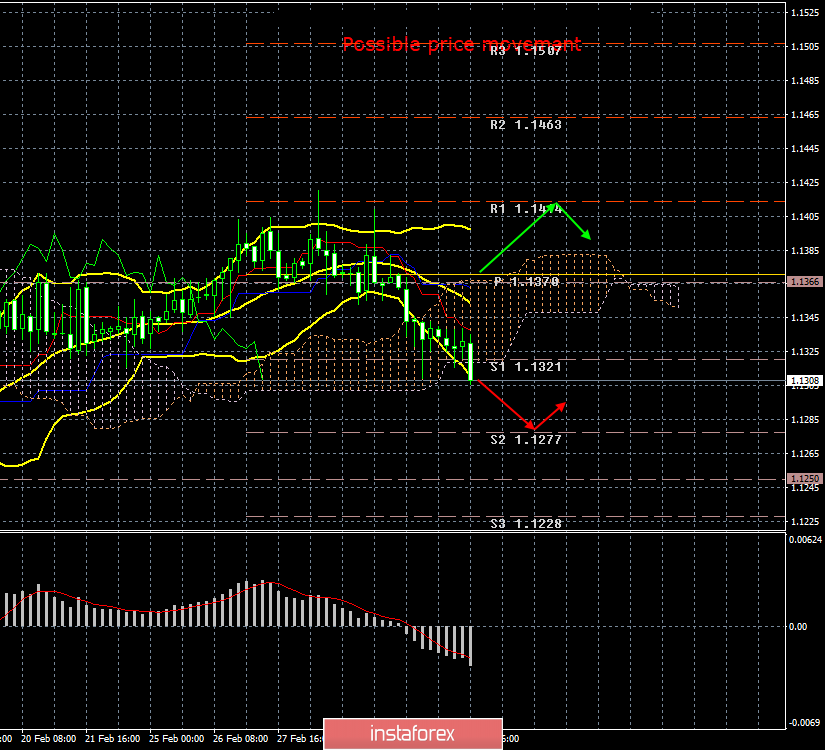
On Tuesday, March 5, the EUR/USD currency pair resumed its downward movement after a short pause. The instrument stood in one place for most of the trading day since there were no important macroeconomic publications at that time. As we mentioned this morning, Markit's business activity indices for services and manufacturing in the US and the EU are more informative. Thus, traders were pleased to ignore the business activity indices in the eurozone, which exceeded forecasts, the business activity indices for the US, which were worse than market expectations, and at the same time, retail sales in the EU, the growth rate of which accelerated in January. But the really important index of business activity in the service sector ISM did not go unnoticed. This figure significantly exceeded forecast that were already high and amounted to as much as 59.7 units. After that, the US dollar began to rise in price. Thus, the naked eye can see that the pair has once again aimed at the area of the lows near the level of 1.1250. There is only 50 points in this area. Given the weakness of the bulls and the lack of strong fundamental reasons for the strengthening of the euro, this time the pair may go below the designated area. Much will depend on the ECB's decisions and statements, which are scheduled for tomorrow. Although what to expect from the European regulator in the face of falling macroeconomic indicators and uncertainty on Brexit? Certainly not a "hawkish" rhetoric. Thus, there is little hope for the ECB. From a technical point of view, the current "dead cross" may increase at the current bar if the price overcomes the Ichimoku cloud.
Trading recommendations:
The EUR/USD pair continues its downward movement. Therefore, at the moment it is recommended to consider short positions with targets 1.1277 and 1.1250. In case of a reversal of the MACD indicator up, manually cut the shorts.
Long positions will again become relevant no earlier than when the price consolidates above the critical line. In this case, the actual target for buy positions will be the resistance level of 1.1414.
In addition to the technical picture should also take into account the fundamental data and the time of their release.
Explanation of illustration:
Ichimoku Indicator:
Tenkan-sen-red line.
Kijun-sen – blue line.
Senkou span a – light brown dotted line.
Senkou span B – light purple dotted line.
Chikou span – green line.
Bollinger Bands Indicator:
3 yellow lines.
MACD:
A red line and a histogram with white bars in the indicator window.
The material has been provided by InstaForex Company - www.instaforex.com