
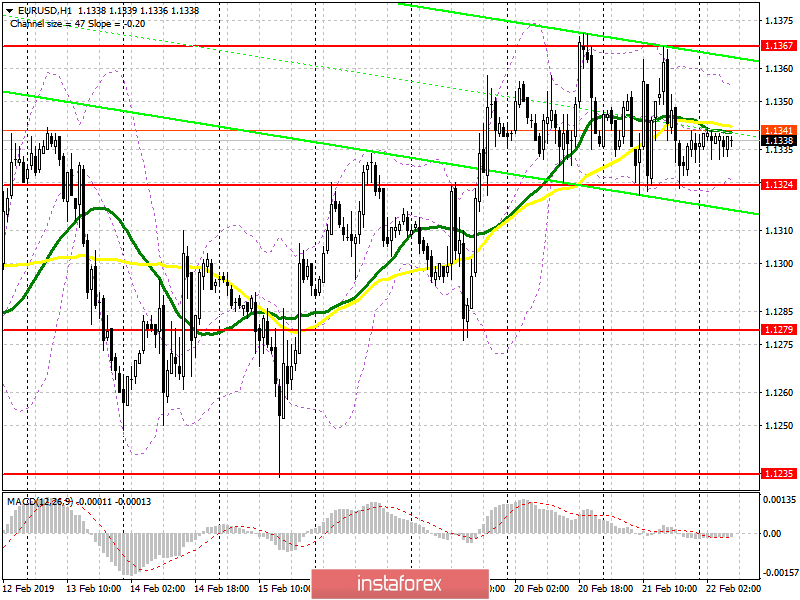
To open long positions on EURUSD you need:
Yesterday's data for the eurozone and for the United States did not allow traders to decide on market's future direction, which will keep trading in the side channel at the moment. Today, in the first half of the day, a breakdown and consolidation above the resistance of 1.1367 is required, which will lead to a larger upward correction in the area of highs at 1.1394 and 1.1432, where I recommend taking profits. In case the EUR/USD declines, long positions can be opened on the condition that a false breakdown is formed in the support area of 1.1324 or on a rebound from a low of 1.1279.
To open short positions on EURUSD you need:
Sellers will count on the formation of a false breakdown in the area of resistance at 1.1367, but you can also see sales in case the pair fails to reach above the middle of the channel in the area of 1.1345. This will lead to a downward correction in the support area of 1.1324, where the bears will count on its breakthrough for today, with selling towards the area of a low of 1.1279, where I recommend taking profits. Weak inflation data can lead to such a scenario. Under the option of a further upward correction and a break of 1.1367, the euro can be sold for a rebound from a high of 1.1394.
Indicator signals:
Moving averages
Trade is conducted in the area of 30-day and 50-day moving averages, which again indicates market uncertainty.
Bollinger bands
In case of growth, the upper limit of the Bollinger Bands indicator around 1.1355 will limit the upward potential of the euro. A break of the lower border of the indicator around 1.1324 will lead to a larger decline in the euro.
Description of indicators
- MA (moving average) 50 days - yellow
- MA (moving average) 30 days - green
- MACD: fast EMA 12, slow EMA 26, SMA 9
- Bollinger Bands 20