
Technical outlook:
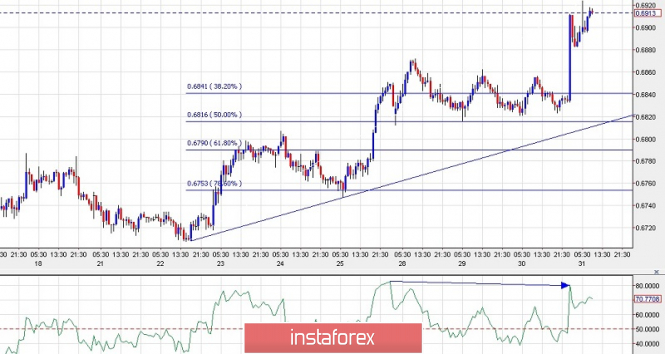
The hourly chart for NZD/USD has been displayed again for a short-term wave structure view. As discussed yesterday, NZD/USD broke out of the triangle consolidation after a slight dip (wave E, not labelled here), and has hit our soft target at 0.6900/20 levels. The wave structure looks complete now from 0.6700/20 lows and a potential pullback or retracement should be more probable from here. Also please note that the RSI has indicated a bearish divergence highlighted below, adding to the probability of a bearish move ahead, which could just be a counter trend. The fibonacci support levels begin from 0.6840 and spread through 0.6790 respectively. It could be ideal to watch out for strong support coming in around 0.6790, which is fibonacci 0.618 levels, going forward.
Trading plan:
Aggressive traders may want to short now @ 0.6910/13, stop @ 0.6830, target 0.6840
Conservative traders may remain flat.
Good luck!
The material has been provided by InstaForex Company - www.instaforex.com