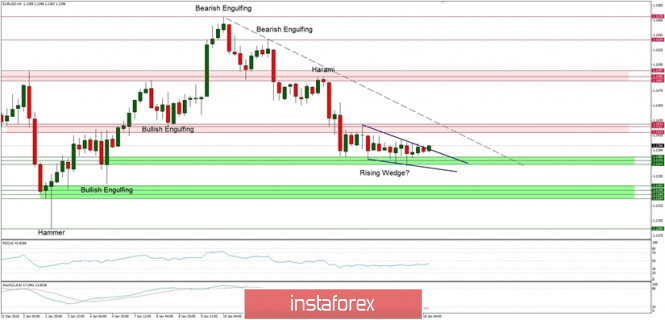
After a series of Bearish Engulfing candlestick patterns at the level of 1.1539 and 1.1570 that established the downtrend, the market has made the Bearish Harami around the level of 1.1483 and went down again to stop around the level of 1.1371. This move down has terminated at the technical support zone between the levels of 1.1371 - 1.1380 and is still in progress. The possible price pattern in development is a Rising Wedge, that creates an opportunity for the price to break out of this narrow range and head higher towards the level of 1.1414, 1.1420 or 1.1425 (the nearest supply zone). The Riging Wedge breakout will be confirmed once the market will clearly violate the technical resistance at the level of 1.1425.
The oversold market conditions support the short-term bullish bias and a clear bullish divergence between the price and the momentum indicator (RSI) supports the bullish outlook as well.
Please notice the daily time frame trend is neutral to negative, so any upside breakout should be considered a local correction in a downtrend only. The larger time frame horizontal range has been established between the levels of 1.1214 - 1.1570.