
Technical outlook:
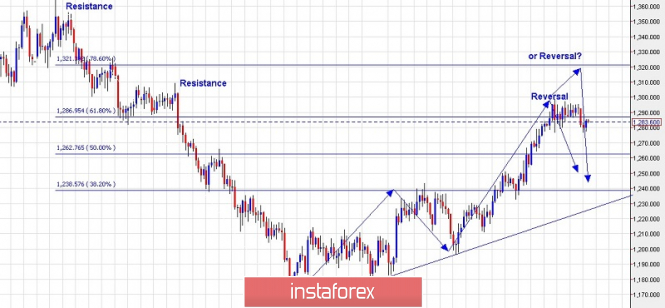
A 4-hour chart has been depicted here for a larger view of waves forming in Gold since last several months and also going forward. Gold is seen to be trading around $1,283/84 levels at this point, very close to fibonacci 0.618 resistance of the entire drop between $1,265 and $1,160 levels respectively. Please note that immediate resistance is seen at $1,310, while support is at $1,230/40 levels respectively. The metal is expected to reverse either from current price action or after pushing higher towards $1,310 levels which is fibonacci 0.786 resistance as well. In either case, an ideal trading strategy should be to look to sell on rallies between $1,300/10 levels, with a potential target below $1,160 levels respectively. Furthermore, please note that a consistent break below the counter trend line support will be required to confirm a long term bearish view.
Trading plan:
Look to sell between $1,300 and $1,310, stop above $1,330, target is open.
Good luck!
The material has been provided by InstaForex Company - www.instaforex.com