
To open long positions on EURUSD you need:
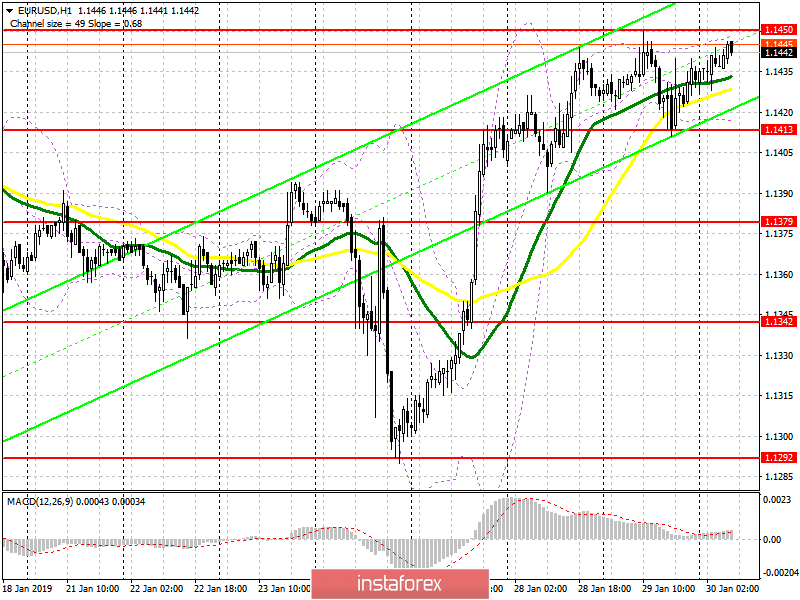
The lack of fundamental data yesterday made it possible for buyers of the euro to maintain their position to build the next uptrend. At the moment, it is necessary to break the resistance of 1.1450, which will lead to a new growth of EUR/USD in the area of highs of 1.1490 and 1.1526, where I recommend to take profit. In case the euro declines in the first half of the day, you can look at long positions on a false breakout from the support level of 1.1413 or on a rebound from the low of 1.1379. However, the main movement will depend on today's decision on interest rates from Federal Reserve.
To open short positions on EURUSD you need:
Another unsuccessful consolidation in the first half of the day above the resistance of 1.1450 may lead to a re-decrease in EUR/USD in the area of the lower boundary of the side channel of 1.1413, the breakthrough of which will lead to a larger sell-off with the test of the lows of 1.1379 and 1.1342, where the main downward movement of course will depend on what the Fed members says during the press conference. In case the EUR/USD grows above the resistance of 1.1450, I recommend to look at the long positions on the rebound from the highs of 1.1490 and 1.1526.
Indicator signals:
Moving averages
Trading is conducted in the area of 30-day and 50-day moving averages, which indicates the formation of the lateral nature of the market with a likely change in the upward trend.
Bollinger Bands
The volatility of the Bollinger Bands indicator decreases, which does not give signals on entering the market and is another evidence of the withdrawal of large euro buyers from the market.
Description of indicators
- MA (moving average) 50 days - yellow
- MA (moving average) 30 days - green
- MACD: fast EMA 12, slow EMA 26, SMA 9
- Bollinger Bands 20