
Gold price has made a new higher maximum. However, there are some bearish divergence signs on the H4 chart that provide a warning for bulls. The price has stopped at the 50% Fibonacci retracement of the decline from $1,365. We must keep an eye on the RSI resistance trend line to find a clue for a rejection or an upside.
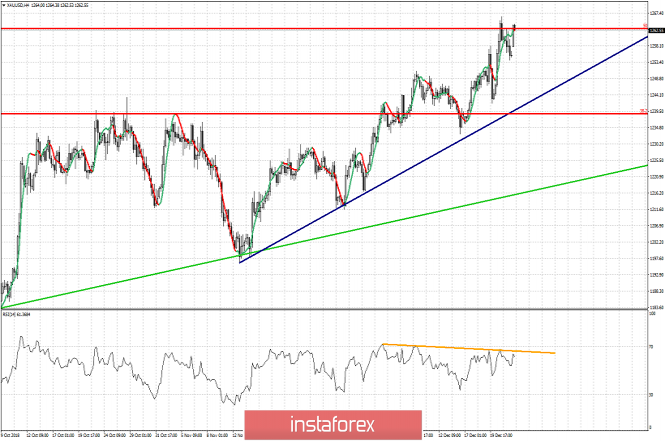
Yellow line - bearish RSI divergence
Green line - major trend line support
Gold price continues to make higher highs and higher lows. The RSI is diverging on the H4 chart. A break above the yellow trend line resistance of the RSI would be a sign of strength and I would not go against it. A rejection at the current levels and a break below the short-term support at $1,253 would open a way for a pullback towards the short-term trend line support near $1,240.
The material has been provided by InstaForex Company - www.instaforex.com