
Technical outlook:
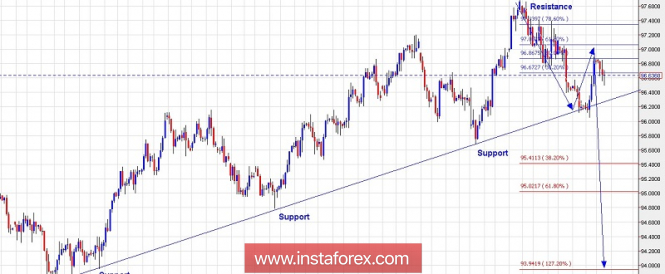
The US Dollar Index pulled back to 96.80/90 levels today, after forming interim lows at 96.10 levels as seen on the 4H chart depicted here. It remains possible for the index to continue its corrective rally through 97.00/10 levels forming a down gartley corrective wave structure, before resuming its downswing. Also note that if prices fail to break below 96.00 levels going forward it would be a threat to 97.70 levels which is defined as an intermediary resistance at the moment. Nevertheless, resistance should be strong around 97.00/10 levels since it is fibonacci 0.618 of the drop between 97.70 and 96.10 respectively. A downside potential target is seen at 95.00 levels followed by 94.00 and lower, going forward.
Trading plan:
Remain short from here, stop above 97.70, a target is below 95.00
Good luck!
The material has been provided by InstaForex Company - www.instaforex.com