
EUR/USD has bounced as expected from 1.1230 area towards 1.13 as we expected in our previous analysis. Here at 1.13 we have short-term confluence of resistance. Previous lows that was once support is here. 38% Fibonacci retracement is here. And our own proprietary indicator resistance is here as well.
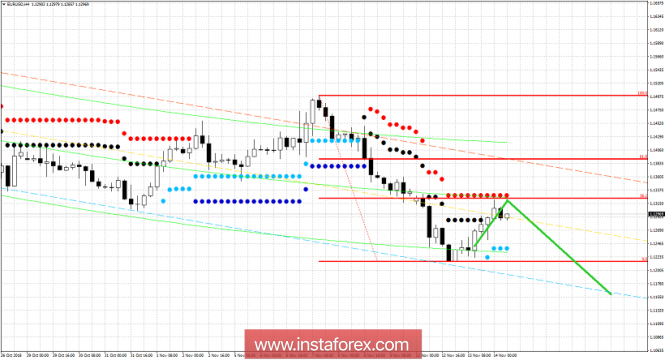
Blue dots - short-term medium strength support
Green lines - expected path
On a daily basis resistance is at 1.1375 while at 1.1390 we have the 61.8% Fibonacci retracement resistance. If EUR/USD manages to break and hold above the red dots in the 4 hour chart, we could then see a move towards the 1.1375-1.1390 area. A rejection at current level of resistance at 1.13 could lead to new lows. Support is at 1.1240-1.1220. Breaking below this level will push price below 1.12 towards 1.1150.
The material has been provided by InstaForex Company - www.instaforex.com