
To open long positions for EURUSD, it is required:
The European currency recovered its position in the pair with the US dollar after the release of a good report on the indicator of the business environment from the IFO. Consolidation at 1.1763 maintains upward potential, and as long as trade is above this level, the demand for the euro will remain. The main daily target will be the resistance of 1.1801, where I recommend to take profit. In the event of a decrease in the EUR/USD in the second half of the day, it is best to consider long positions on the rebound from 1.1726.
To open short positions for EURUSD, it is required:
To return to the market, sellers need to decline to the level of 1.1763, which will lead to profit taking in long positions and an update of the low of the day in the area of 1.1726, where I recommend to lock in the profit. In case of a further upward trend in the EUR/USD after the speech of the President of the European Central Bank Mario Draghi, which is scheduled for the second half of the day, short positions can be considered after the update of the resistance of 1.1801, or on a rebound from the monthly high of 1.1830.
Indicator signals:
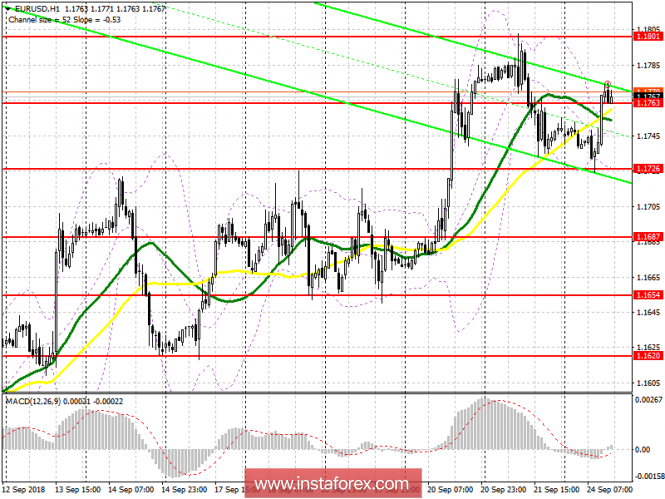
Moving averages
The 30-day moving average and 50-day average are at the same level, which limits the upward potential in the euro.
Bollinger Bands
Bollinger bands indicate a sharp decline in market volatility ahead of the important speech of Mario Draghi and do not give signals to enter the market.
Indicator description
- Moving Average (average sliding) 50 days - yellow
- Moving Average (average sliding) 30 days - green
- MACD: fast EMA 12, slow EMA 26, SMA 9
- Bollinger Bands 20