
To open long positions for EUR / USD pair, you need:
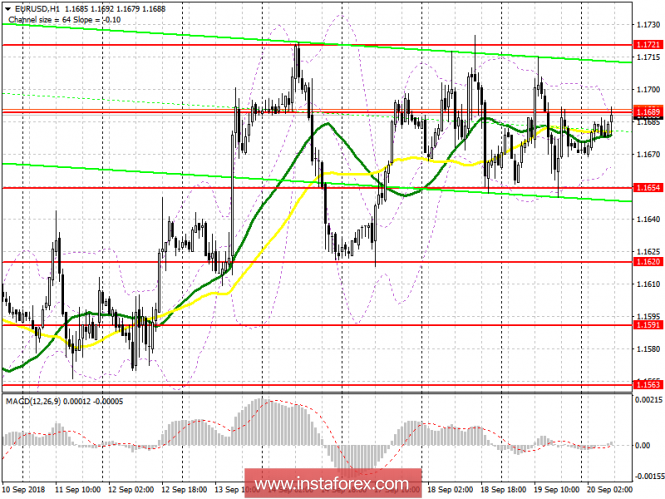
Yesterday, the market was traded in the side channel and the buyers could not do anything with monthly highs once again, so you need to be extremely cautious. It is better to consider new long positions after returning and consolidating above the middle of the channel 1.1689, which will lead to the update of this week's highs around 1.1722-25, where fixing profits are recommended. In case the bulls do not manage to climb above 1.1689, you can look at long positions at a false breakdown from the lower border of the lateral channel at 1.1654 or open long positions in EUR / USD pair for a rebound from 1.1620.
To open short positions for EUR / USD pair, you need:
Sellers in the first half of the day will try to keep the resistance level of 1.1689. The formation of a false breakout on it will be a direct signal to the opening of short positions in EUR / USD pair with the aim of re-testing the lower border of the channel 1.1656, the breakdown of which will lead to an immediate sellout of the euro with a yield to the lows in areas 1.1620 and 1.1591. In the case of growth above 1.1689 in the European session, sales can be returned immediately to a rebound when approaching resistance 1.1722-25.
Indicator signals:
Moving Averages
The 30-day moving average is on par with the 50-day average, which indicates the lateral nature of the market.
Bollinger Bands
The channels are narrowing, which indicates a decrease in the volatility of the market before a possible change in the uptrend.
Description of indicators
- MA (average sliding) 50 days - yellow
- MA (average sliding) 30 days - green
- MACD: fast EMA 12, slow EMA 26, SMA 9
- Bollinger Bands 20