
Technical Outlook:
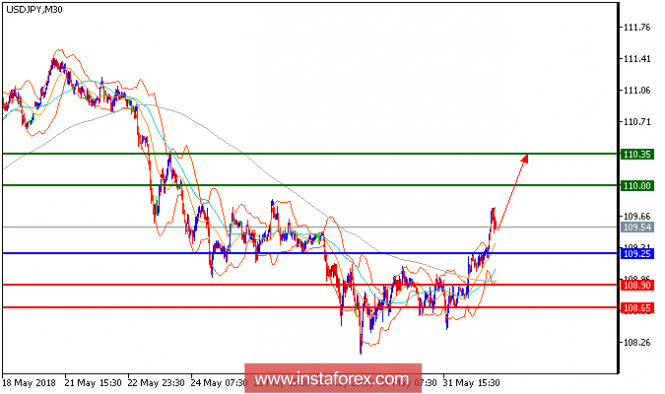
USD/JPY is expected to trade with a bullish outlook. The pair recorded a series of higher tops and higher bottoms, which confirmed the bullish outlook. The 50-period moving average is acting as a support now. The relative strength index is bullish above its neutrality level at 50, calling for a new up leg. To sum up, as long as 109.25 holds on the downside, look for a further advance with targets at 110 and 110.35 in extension.
Fundamentals Overview:
The latest signs of a robust job market will strengthen the hands of officials who favor four rate moves in 2018. Officials will update their projections for the rate path at their meeting on June 12-13. Unemployment fell to 3.8% in May—the lowest level in 18 years—after declining to 3.9% in April. The rate had held at 4.1% for the six months before that.
Joblessness is now well below the level all the Fed's officials regard as likely to be sustainable over the long run without fueling excessive inflation and asset bubbles. Employers have added more than 200,000 jobs a month this year, well above the level the Fed's officials think is needed to hold the jobless rate steady.
Chart Explanation: The black line shows the pivot point. Currently, the price is above the pivot point which is a signal for long positions. If it remains below the pivot point, it will indicate short positions. The red lines show the support levels, while the green line indicates the resistance levels. These levels can be used to enter and exit trades.
Resistance levels: 110.00, 110.35, and 110.75
Support levels: 108.90, 108.65, and 108.30
The material has been provided by InstaForex Company - www.instaforex.com