
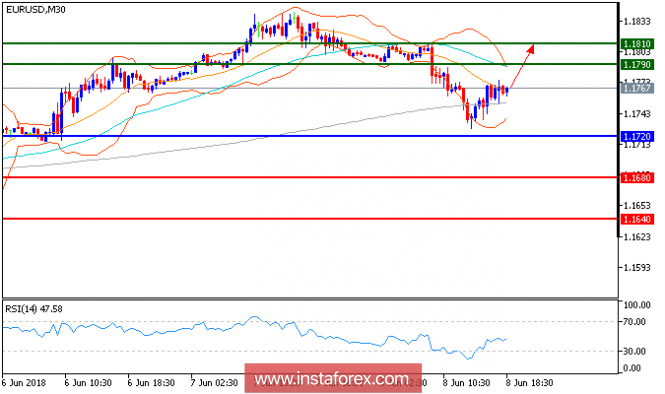
Technical Outlook: EUR/USD is expected to trade with a bullish outlook. The pair retreated from 1.1835 and broke below its 20-day and 50-day moving averages. Besides, the death cross between the 20-day and 50-day moving averages has been identified. The relative strength index is around its neutrality area , calling for a further consolidation. Hence, as long as 1.1720 is not surpassed, look for a new test with targets at 1.1790 and 1.1810 in extension.
Fundamental Overview: , The U.S. dollar continued to lose ground to the euro, as more investors expected the European Central Bank to hint the winding down of its bond-buying program at next week's monetary policy meeting. EUR/USD marked a day-high of 1.1840, its highest intraday level since May 16.
Chart Explanation: The black line shows the pivot point. Currently, the price is above the pivot point which is a signal for long positions. If it remains below the pivot point, it will indicate short positions. The red lines show the support levels, while the green line indicates the resistance levels. These levels can be used to enter and exit trades.
Resistance levels: 1.1790, 1.1810, 1.1840
Support levels: 1.17680, 1.1640, 1.1600
The material has been provided by InstaForex Company - www.instaforex.com