In the first three months of 2018 new owners found 973.5 tonnes of gold. This is 7% less than last year and the weakest result of the first quarter since 2008 - the World Gold Council (WGC) informed.
Demand for gold jewelry remained stable and amounted to 487.7 tons, which is only 1% less than a year earlier. Purchases were halted by Indians (-12% YoY), for whom gold jewelry became too expensive due to the weakening of rupees. However, sales in China increased by 7% on a yearly basis. The demand generated by central banks, which acquired 116.5 tons of gold, remained stable, close to the many-year average. Almost 80% of these purchases were made by the monetary authorities of Russia, Turkey and Kazakhstan. Therefore, the global investors were responsible for the reduction of demand. Investment demand dropped by as much as 27% YoY. At the same time, the number of bars and coins purchased by retail investors decreased by 15%. The demand for gold bullion in China dropped by as much as 26% YoY, but the absolute result (78 tons) was still at a quite decent level.
Investors in India, smothered by an increasingly repressive tax office, reduced purchases of investment gold by 13% YoY, to 27.9 tons. US residents purchased only 3.7 tons of gold broth - less than 10 years and as much as 59% less than last year. Purchases in Europe decreased by 39% YoY, where the perception of political risk decreased significantly over the last months. On the other hand, the demand for investment gold in the turbulent inflation of Turkey increased rapidly, where purchases increased by 47% YoY. The same was true in Iran (250% increase), whose residents may be afraid of new American economic sanctions.
The ETF (Exchange Traded Funds) funds reduced purchases by 66% to just 32.4 tons. Despite the smaller inflow of cash from investors, ETFs at the end of the first quarter had more than 2,400 tons of gold - the highest since April 2013. That is, from the sudden collapse in the price of bullion, which initiated the four-year-old bear market.
However, after the end of the first quarter, cash again flowed into the "golden" ETFs again. In April, the funds bought 70 tons of yellow metal, which meant an inflow of around 3 billion dollars of fresh cash. According to the authors of the WGC report, investors took a long position in gold under the influence of fears over the outbreak of a trade war between the US and China and the growing tension between Washington and Moscow.
Global gold mining was stable, growing by 1.4% compared to the same quarter of the previous year. Globally, 770 tons of gold was extracted in the first quarter of 2018 - just like in the previous two years. Extraction has decreased in China, Peru, and South Africa, as well as in the US and Afghanistan. More ore flowed from mine in Indonesia and Canada and Russia.The supply of recycled gold remained at a relatively low level. From this source, just over 287 tons of metal went to the market, which is practically the same as a year ago. They were, therefore, the lowest values since 2007. So even slightly higher prices were not able to induce its owners to part with the royal metal.
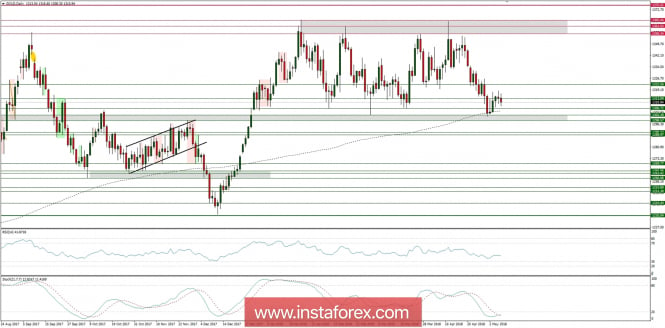
Let's now take a look at the Gold technical picture at the daily timeframe. The lack of the demand can be clearly seen at this timeframe chart as from the end of the January the market is in a corrective cycle. The corrective zone is now being stretched between the levels of $1,300 - $1,365 with the 200 days moving average at the level of $1,305. Nevertheless, the overall market conditions are now oversold, so the global investor might see some bounce higher in the prices of Gold. The key technical resistance is seen at the level of $1,320 and only if this level is clearly broken, the bull might push the prices towards the level of $1,335 or even $1,355 again. On the other hand, a deeper downside correction below the level of $1,300 would open the road towards the support at the levels of $1,290 and in a case of the extension - $1,270.