
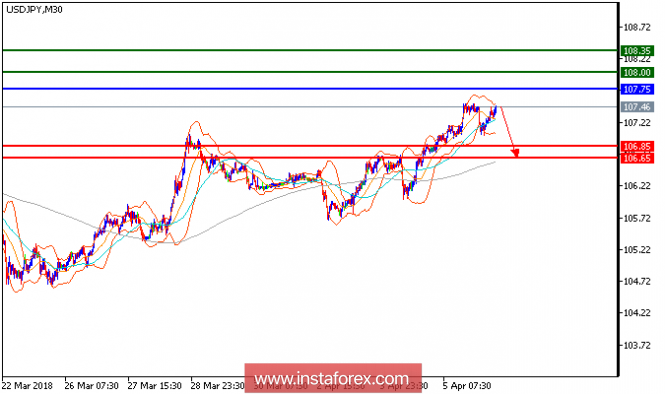
USD/JPY is under pressure and expected to continue its downside movement. The pair has fallen to levels below both the 20-period and 50-period moving averages and is striking against the lower Bollinger band, calling for acceleration to the downside. Downward momentum is further evidenced by the relative strength index, which is badly in the 30s. The intraday outlook has turned bearish and the pair is expected to sink further toward 106.85 before targeting 106.65. Only a return to 107.50 would bring about a bullish reversal.
Chart Explanation: The black line shows the pivot point. The present price above the pivot point indicates a bullish position, and the price below the pivot point indicates a short position. The red lines show the support levels, and the green line indicates the resistance levels. These levels can be used to enter and exit trades.
Strategy: SELL, stop loss at 107.75, take profit at 106.85
Resistance levels: 106.85, 106.65, and 106.30
Support levels: 108.00, 108.35, and 108.75.
The material has been provided by InstaForex Company - www.instaforex.com