
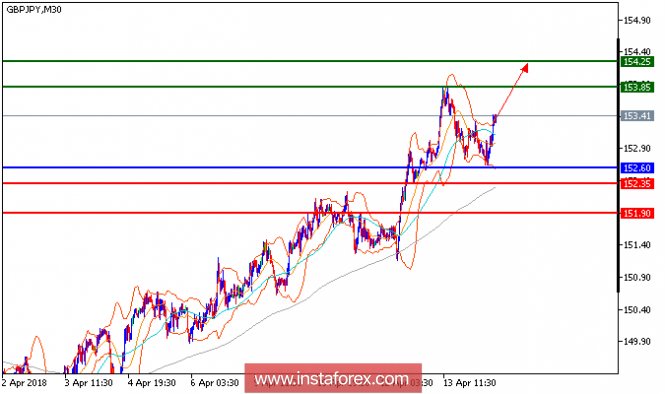
GBP/JPY is expected to trade with a bullish outlook. The pair rebounded from 152.60 and broke above its 20-period and 50-period moving averages. The relative strength index is bullish and calls for a further upside. To conclude, as long as 152.60 holds on the downside, look for a new rise with targets at 152.35 and 151.90 in extension.
Chart Explanation: The black line shows the pivot point. Currently, the price is above the pivot point which is a signal for long positions. If it remains below the pivot point, it will indicate short positions. The red lines show the support levels, while the green line indicates the resistance levels. These levels can be used to enter and exit trades.
Resistance levels: 153.85, 154.25, and 155
Support levels: 152.35, 151.90, and 151.00.
The material has been provided by InstaForex Company - www.instaforex.com