
Gold price is trading above $1,350 but still below January highs. Trend is bullish in the short-term as long as the price is above $1,350. I believe Gold has more chances of a pull back for a higher low than a continuation of the upward trend. Only aggressive traders should try a short position.
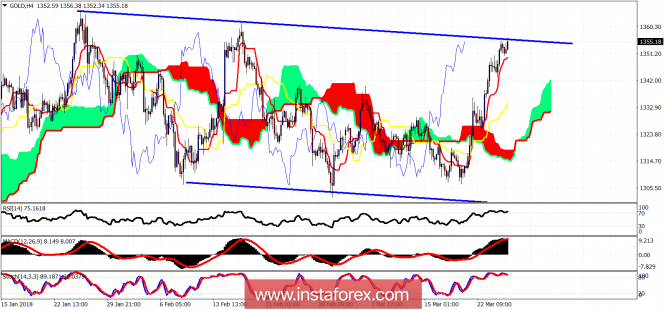
Blue lines - trading range
Gold price is above both the tankan- and kijun-sen indicators. Support is at $1,350 and next at $1,334. I expect a pull back from current levels and the creation of a higher low in the area of $1,310-$1,325. Resistance is at $1,357-65.
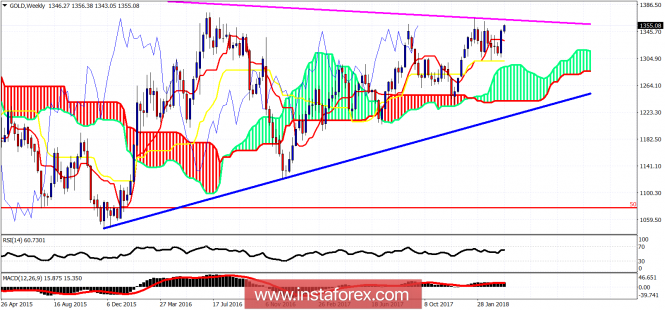
Magenta line - long-term resistance
Blue line - long-term support
Gold price is testing the long-term resistance trend line at $1,355-65 area once again. Trend is bullish as the price is above both the tankan- and the kijun-sen indicators. Weekly support is at $1,331 and next at $1,300. So far, the price has respected all support levels but has not broken above the critical long-term resistance. I expect this resistance to eventually break and we will see the Gold price above $1,400.
The material has been provided by InstaForex Company - www.instaforex.com