
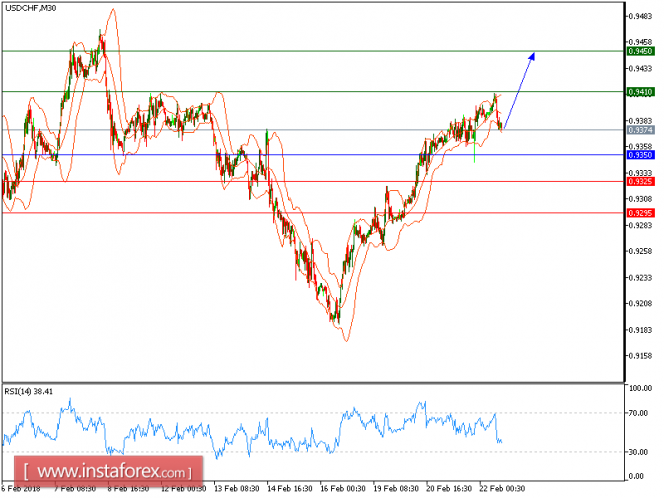
All our upside targets which we predicted in yesterday's analysis have been hit. USD/CHF is expected to continue its upside movement. The pair has recorded a process of higher tops and higher bottoms since February 16, confirming a bullish outlook. Both rising 20-period and 50-period moving averages should push the prices higher. The relative strength index advocates for a further upside.
Hence, as long as 0.9350 is not broken, look for a further advance to 0.9410 and even to 0.9450 in extension.
Chart Explanation: The black line shows the pivot point. The present price above the pivot point indicates a bullish position, and the price below the pivot point indicates a short position. The red lines show the support levels, and the green line indicates the resistance levels. These levels can be used to enter and exit trades.
Strategy: BUY, stop loss at 0.9350, take profit at 0.9410.
Resistance levels: 0.9410, 0.9450, and 0.9485
Support levels: 0.9325, 0.9295, and 0.9250.
The material has been provided by InstaForex Company - www.instaforex.com