
The Dollar index is making new lows as expected. Trend remains bearish. Target area for the downward move to be complete is around 87.50. This does not mean that the decline could end sooner. Bears should not get overconfident, as there are important divergence signals.
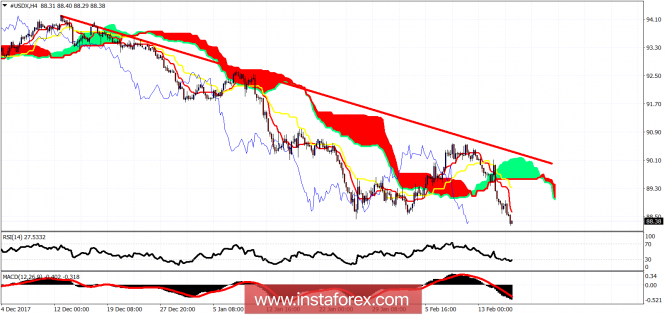
Red line - resistance
In the 4 hour chart the price remains in a bearish trend below the 4 hour Kumo and the red trend line resistance. Support is now around 87.60, and this could be our final target after a short-term bounce. Resistance is at 89.40-89.60. As long as the price is below that level, there is no reversal indication.
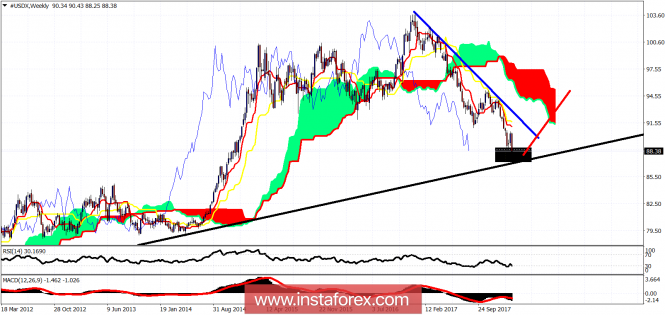
Black line - long-term support trend line
Black rectangle - target area
Red line - price expectations
The Dollar index is in a weekly bearish trend trading below the weekly Kumo. There are bullish divergence signs by the RSI. I do not expect the price to break below the long-term black trend line of support. I expect the Dollar index to stage a big bounce higher, as I believe, the entire move from 103 is nearly complete and will soon reverse to the upside.
The material has been provided by InstaForex Company - www.instaforex.com