
Technical outlook:
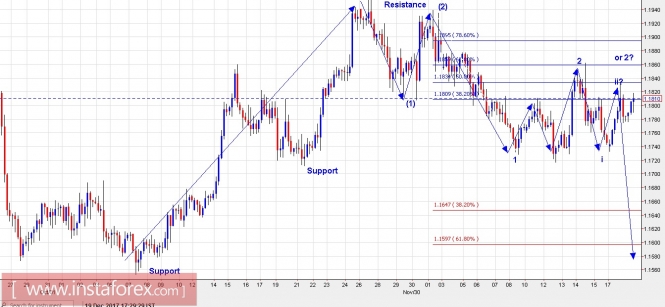
The EUR/USD pair continues to consolidate looking to terminate into a standard flat or contracting triangle structure. It is expected to top out near 1.1860 levels in case of a flat, while prices should remain below 1.1860 levels in case of a triangle. In either cases, the EUR/USD pair is expected to stay below 1.1960 levels going forward, if bears are to stay in control. Resistance should be strong around 1.1840/50 levels, while support is seen at 1.1550 levels respectively. According to the wave counts, the pair is into its wave (3) lower as labelled here and is expected to push through 1.1500 levels at least. On the flip side, a break above 1.1860 and subsequently above 1.1960 would invalidate the following count.
Trading plan:
Please remain short for now, stop above 1.1960, target 1.1600 and 1.1500 levels.
US Dollar Index chart setups:
Technical outlook:
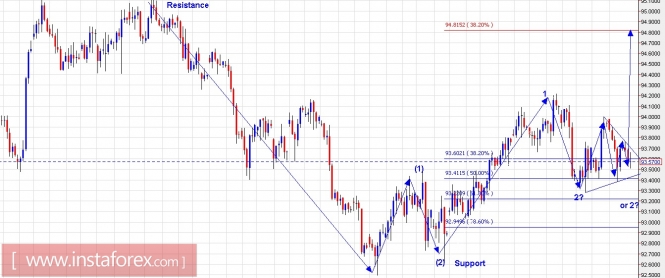
The US Dollar Index is also seen to be consolidating into a potential contracting triangle or flat as depicted above. If it is to form a triangle, prices would remain above 93.30 levels and a break out higher would be seen from here. On the other side, if it to form a flat structure, then prices may re-test 93.20/30 levels going forward. In both the cases, we are expecting a bullish break out through 94.80/95.00 levels and higher respectively. On the flip side, a break below 92.50 levels would confirm that the index is looking to produce other structures. The bullish count stays intact till prices remain broadly above 92.50 levels. Support comes in at 92.60, while resistance is seen at 95.00 levels respectively.
Trading plan:
Please remain long stop below 92.50 and target is 95.00 and 98.00 levels respectively.
Fundamental outlook:
No major fundamental events lined up for the day.
Good luck!
The material has been provided by InstaForex Company - www.instaforex.com