
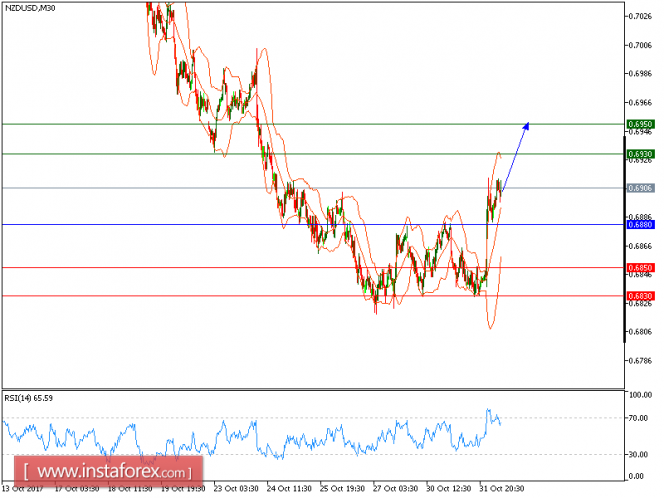
NZD/USD is expected to trade with a bullish outlook. The pair posted a rebound and broke above the upper boundary of Bollinger Bands, which indicated the bullish reversal. The 20-period moving average has crossed above the 50-period one. The relative strength index shows upside momentum.
Therefore, as long as 0.6880 is not broken, look for a further upside with targets at 0.6930 and 0.6950 in extension.
The black line is showing the pivot point. Currently, the price is above the pivot point, which indicates long positions. If it remains below the pivot point, it will indicate short positions. The red lines are showing the support levels and the green line is indicating the resistance levels. These levels can be used to enter and exit trades.
Resistance levels: 0.6930, 0.6950, and 0.6980
Support levels: 0.6850, 0.6830, and 0.6795
The material has been provided by InstaForex Company - www.instaforex.com