
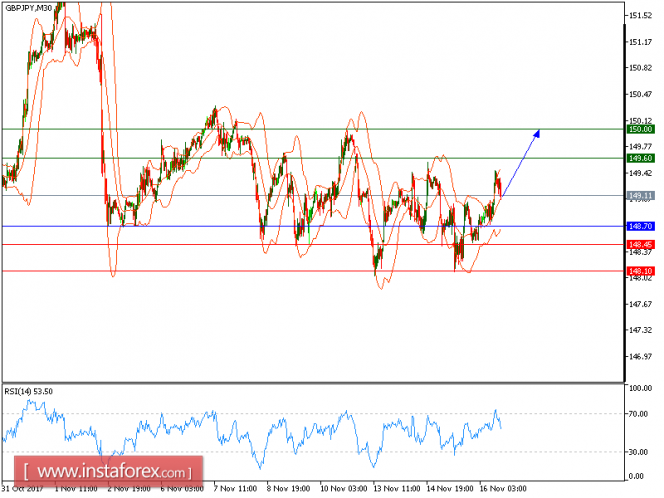
GBP/JPY is expected to trade with a bullish outlook. The pair stands firmly above its nearest support at 148.70, and is likely to post a new rebound towards 149.60. The 50-period moving average is still heading upward, and acts as a support role. In addition, the relative strength index is bullish above its neutrality area at 50.
In which case, as long as 148.70 is not broken, look for further advance to 149.60 and 150.00 in extension.
Alternatively, if the price moves in the direction opposite to the forecast, a short position is recommended below 148.70 with the target at 148.45.
Strategy: BUY, Stop Loss: 148.70, Take Profit: 149.60
Chart Explanation: the black line shows the pivot point. The price above the pivot point indicates long positions; and when it is below the pivot points, it indicates short positions. The red lines show the support levels and the green line indicates the resistance levels. These levels can be used to enter and exit trades.
Resistance levels: 149.60, 150.00 and 150.50
Support levels: 148.45, 148.10, and 147.70
The material has been provided by InstaForex Company - www.instaforex.com