
The pair has started the week with a consolidation above the support zone of 1.3037, at which could gather momentum in order to extend the recovery towards the 200 SMA at H1 chart. However, we're expecting that support zone of 1.3037 gives up to allow a leg lower to test the 1.2880 level. MACD indicator is entering the overbought territory.
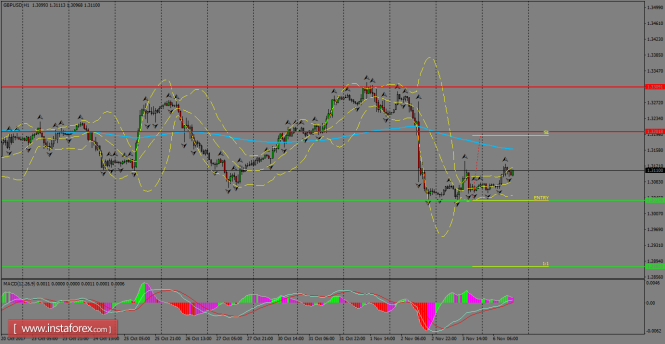
H1 chart's resistance levels: 1.3201 / 1.3309
H1 chart's support levels: 1.3037 / 1.2880
Trading recommendations for today: Based on the H1 chart, sell (short) orders only if the GBP/USD pair breaks a bearish candlestick; the support level is at 1.3037, take profit is at 1.2880 and stop loss is at 1.3193.
The material has been provided by InstaForex Company - www.instaforex.com