
Monthly Outlook
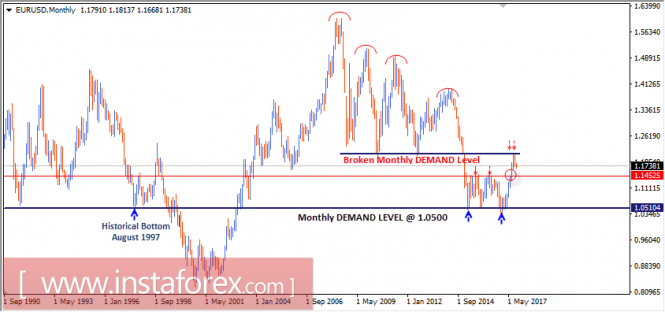
In January 2015, the EUR/USD pair moved below the major demand levels near 1.2050-1.2100 (multiple previous bottoms set in July 2012 and June 2010). Hence, a long-term bearish target was projected toward 0.9450.
In March 2015, EUR/USD bears challenged the monthly demand level around 1.0500, which had been previously reached in August 1997.
In the longer term, the level of 0.9450 remains a projected target if any monthly candlestick achieves bearish closure below the depicted monthly demand level of 1.0500.
However, the EUR/USD pair has been trapped within the depicted consolidation range (1.0500-1.1450) until the current bullish breakout was executed above 1.1450.
The current bullish breakout above 1.1450 allowed a quick bullish advance towards 1.2100 where recent evidence of bearish rejection was expressed.
Daily Outlook
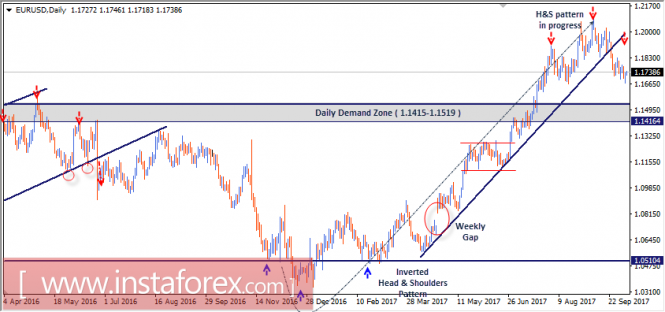
In January 2017, the previous downtrend reversed when the Head and Shoulders pattern was established around 1.0500. Since then, evident bullish momentum has been expressed on the chart.
As anticipated, the ongoing bullish momentum allowed the EUR/USD pair to pursue further bullish advance towards 1.1415-1.1520 (Previous Daily Supply-Zone).
The daily supply zone failed to pause the ongoing bullish momentum. Instead, an evident bullish breakout is being witnessed on the chart.
The next Supply level to meet the pair is located around 1.2100 (Level of previous multiple bottoms) where bearish rejection and a valid SELL entry can be anticipated.
On the other hand, If the current bearish breakout persists below 1.1800 (the depicted uptrend line) and 1.1700, a quick bearish decline should be expected towards the price zone of 1.1415-1.1520 where BUY entries can be offered.
Trade Recommendations
Bullish pullback towards the price zone of 1.1835-1.1850 (the backside of the broken uptrend line) should be considered for a valid SELL entry.
S/L should be placed above 1.1950.
The material has been provided by InstaForex Company - www.instaforex.com