
The Dollar index as expected has made a full-scale reversal since last Friday when we expected for the Dollar to top. Price has broken through cloud support in the short term and is making lower lows and lower highs. Trend is bearish.
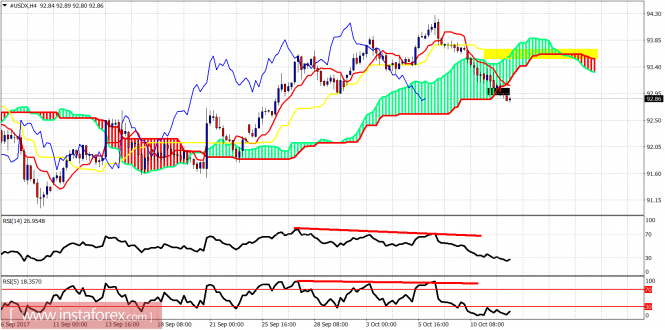
Yellow rectangle - resistance
The Dollar index has broken below the Ichimoku cloud in the 4-hour chart. Price has moved lower as expected when we were trading around 94. Price justifies a bounce soon but it is important to see if this bounce makes a lower high and gets rejected by the Kumo (cloud) resistance.
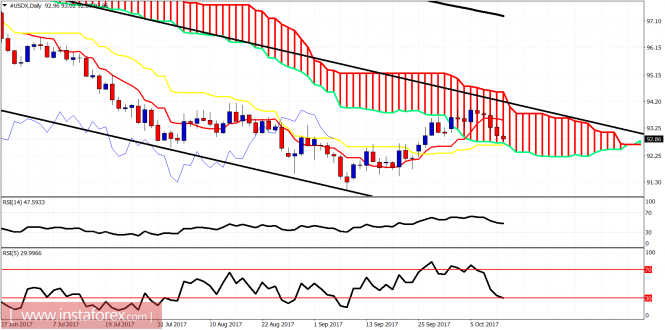
The rejection at the upper channel boundary is unfolding. Price has now reached the lower cloud boundary and the kijun-sen indicator (yellow line). This is important support area for the Dollar index. Price could bounce from this area. As long as we are trading inside the bearish channel, I will continue to be bearish expecting new lows in the Dollar index.
The material has been provided by InstaForex Company - www.instaforex.com