
Overview:
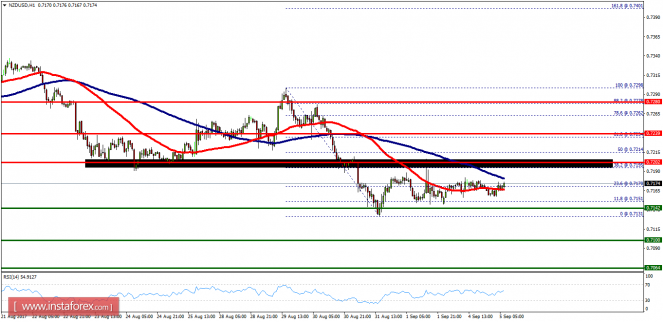
- The NZD/USD pair didn't make any significant movements since last week. There are no changes in our technical outlook. It continued to move downwards from the level of 0.7202 to the bottom around 0.7142. Today, the current price is seen at the level of 0.7170. the first resistance level is seen at 0.7202 followed by 0.7239, while daily support 1 is seen at 0.7100. Furthermore, the moving average (100) starts signaling a downward trend; therefore, the market is indicating a bearish opportunity below 0.7142. So it will be good to sell at 0.7142 with the first target of 0.7100. It will also call for a downtrend in order to continue towards 0.7064 (support 2). The strong daily support is seen at the 0.7064 level, which represents a new double bottom on the H1 chart. According to the previous events, we expect the NZD/USD pair to trade between 0.7202 and 0.7064 in coming hours. The price area of 0.7202 remains a significant resistance zone. Thus, the trend is still bearish as long as the level of 0.7202 is not broken. On the contrary, in case a reversal takes place and the NZD/USD pair breaks through the resistance level of 0.7239, then a stop loss should be set at the price of 0.7280.