
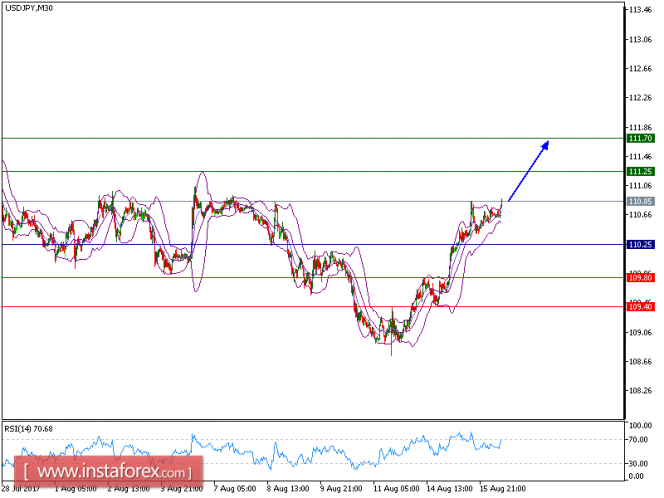
All our targets which we predicted in Yesterday's analysis have been hit. The pair is expected to trade in upside range. The technical outlook of the pair is positive as the prices recorded higher tops and higher bottoms since August 11. The rising 50-period moving average is playing a support role. The relative strength index is above its neutrality level at 50.
Hence, as long as 110.25 holds on the downside, look for a further rise to 110.85 and even to 111.25 in extension.
Alternatively, if the price moves in the opposite direction, a short position is recommended below 110.25 with a target at 109.80.
Chart Explanation: The black line shows the pivot point. The current price above the pivot point indicates a bullish position, while the price below the pivot point is a signal for a short position. The red lines show the support levels and the green line indicates the resistance level. These levels can be used to enter and exit trades.
Strategy: BUY, Stop Loss: 110.25, Take Profit: 111.25
Resistance levels: 111.25, 111.70, and 112.05
Support Levels: 109.80, 109.40, 109.00
The material has been provided by InstaForex Company - www.instaforex.com