
Gold price made new highs yesterday. Short-term trend is bullish. We could see a pullback towards $1,230 but overall I'm expecting a move towards $1,260 at least.
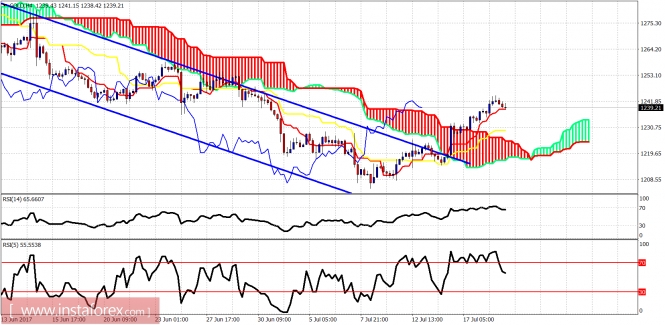
Blue lines - bearish channel
Gold price is trading above the 4-hour Kumo (cloud). Support is at $1,230. Resistance is at $1,250-60. Gold price could see $1,230 if $1,235 is broken. However the cloud support should stop the fall in any case. I believe an important low at $1,205 is in.
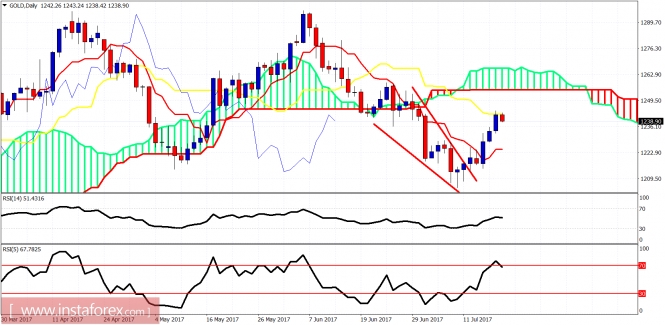
Gold daily chart shows price rising as expected but for now has stopped at the daily kijun-sen (yellow line indicator). $1,243 is daily resistance. Next Gold price should move towards $1,260 once this resistance is broken. Daily support is at $1,225 by the tenkan-sen (red line indicator).
The material has been provided by InstaForex Company - www.instaforex.com