MG Network

something big isHappening!

In the mean time you can connect with us with via:

Copyright © Money Grows Network | Theme By Gooyaabi Templates

Money Grows Network

Archive

Powered by Blogger.

Welcome To Money Grows Network

Verified By

2006 - 2019 © www.moneygrows.net

Investments in financial products are subject to market risk. Some financial products, such as currency exchange, are highly speculative and any investment should only be done with risk capital. Prices rise and fall and past performance is no assurance of future performance. This website is an information site only.

Popular

Pages

Expert In

Name*


Message*

Technical analysis of gold for July 14, 2017

The Gold price bounced towards the upper channel boundary and resistance area of $1,230 and got rejected. The price has turned back lower towards $1,215. Gold bulls need to break above $1,230 in order to confirm that an important low is in.

analytics59686cf40f448.jpg

Blue lines - bearish channel

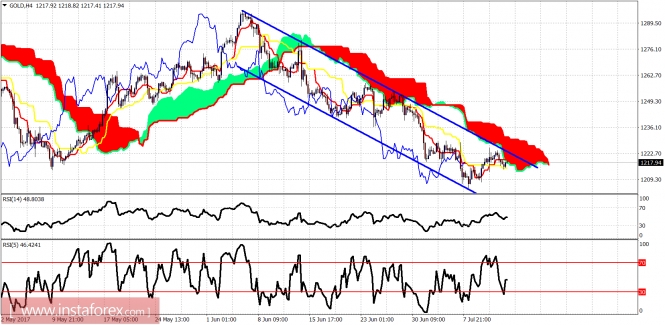
The Gold price is below the Kumo (cloud) and still inside the bearish channel. Support is at $1,205 and next support is at $1,190. Resistance is at $1,230.

analytics59686d2e24066.jpg

Red lines - wedge pattern

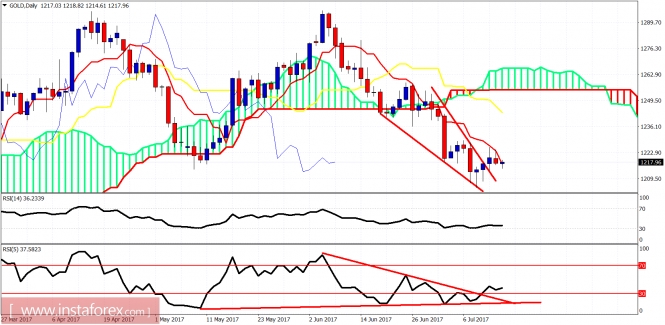
The Gold price broke out of the downward sloping wedge pattern but the tenkan-sen (red line indicator) is providing important resistance and bulls cannot overcome this obstacle...yet. I believe that eventually the Gold price will turn back again upwards and break above $1,230 and move at least towards $1,260.

The material has been provided by InstaForex Company - www.instaforex.com