
Technical outlook:
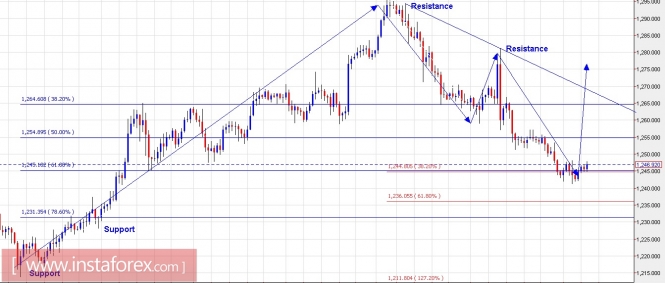
Gold is looking to produce a bullish reversal today. Should it manage to close above $1,252.00 at least, the yellow metal would confirm the bullish scenario as well. Please note that a number of convergences is seen through $1,241/45 levels as depicted above. The fibonacci 0.382 extension of a counter trend is matching up the fibonacci 0.618 retracement of the trending wave. Furthermore, prices are also seen to be bouncing right from a 6-month trend line support as seen on the Daily chart (not provided here). A push through $1,257.00 would also confirm that the uptrend has resumed towards $1,390.00 levels at least in the weeks to follow. Immediate support is seen around $1,230 levels, while resistance is at $1,257 levels respectively.
Trading plan:
Remain long on Gold for now, stop is below $1,230, target is from $1,390 and higher.
US Dollar Index chart setups:
Technical outlook:
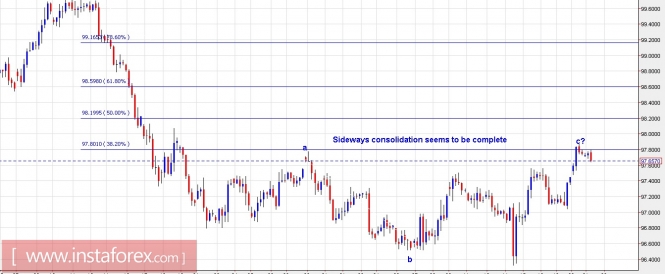
The US Dollar Index also seems to have completed its sideways consolidation structure around 97.80 for now. Moreover, the complex corrective structure a-b-c looks to be taking resistance from the fibonacci 0.382 levels as well, which is a typical co-relation for a wave 4 termination. If this wave count is correct and it comes to be true, we should see prices dropping lower from here and continue to print below 96.30 to complete wave 3 of a larger degree before resuming its rally. On the flip side, it the index pushes beyond 98.00/10 levels from here it would mean that the flat corrective structure is not complete yet and should terminate around 99.00 levels. In either case, we shall be looking to remain short (on rallies) going forward.
Trading plan:
Please remain short, stop is at 98.20/30, targeting below 96.30.
Fundamental outlook:
There are no major events for the rest of the day.
Good luck!
The material has been provided by InstaForex Company - www.instaforex.com