Trading plan for 01/06/2017:
After the poor data from China, AUD was heavily sold. The Shanghai Stock Exchange moved down, but the rest of the indexes are trading flat. GBP/USD is coming down from the highs as the political issues are setting the tone for trade. Crude Oil rebounded after better-than-expected stockpiles data.
On Thursday 1st of June, the event calendar is quite busy with important news releases, so global investors will pay attention to PMI Manufacturing data from the Eurozone and the UK, ADP Non-Farm Employment Change, Unemployment Claims, and ISM Manufacturing PMI from the US.
GBP/USD analysis for 01/06/2017:
The PMI Manufacturing from the UK data are scheduled for release at 08:30 am GMT and market participants expect a slight decrease from 57.3 points last month to 56.5 points for the month of May. Importantly, April saw a substantial upside surprise with the PMI rising to a 3-year high of 57.3 points, so a slight decline from the highs is not the end of the world. Since consumer spending is looking softer, the UK will need to see more growth from the manufacturing sector to compensate, which should be supported by a softer Pound and stronger foreign demand. If today's data will meet the expectations, then some profit taking might occur on GBP main pairs and crosses.
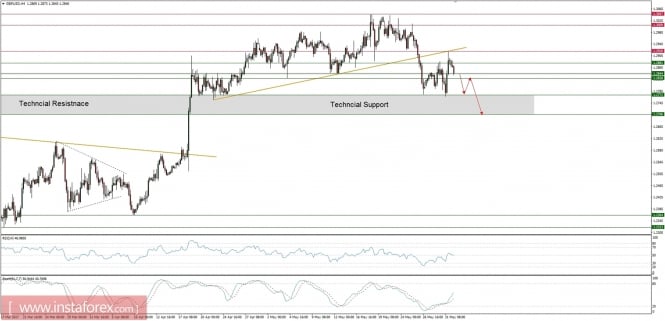
Let's now take a look at the GBP/USD technical picture on the H4 time frame. The price has tested the golden trend line resistance from below and reverse. Currently, the price is trading close to the old known supports levels at 1.2828 and 1.2844, but the most important support is seen at the level of 1.2772. Any breakout below this level would lead to the test of another support at the level of 1.2706. The momentum indicator are still trading around the fifty level, but stochastic is bouncing from the oversold zone.
EUR/USD analysis for 01/06/2017:
The ADP Non-Farm Employment Change and Unemployment Claims from the US are scheduled for release at 12:30 pm GMT and market participants expect a tick down on the US job market. The number of unemployed people in the US is expected to increase slightly from 234k to 239k and the number of newly employed people in the US, excluding workers in the farming industry, is expected to increase slightly from 177k to 181k people. The Continuing Claims (unemployed workers that qualify for benefits under unemployment insurance) are expected to be a tad lower, down from 1923k to 1920k. It looks like the general outlook for the US job market remains solid and today's and tomorrow's data should continue to provide a good justification for FED to hike the interest rates in June.
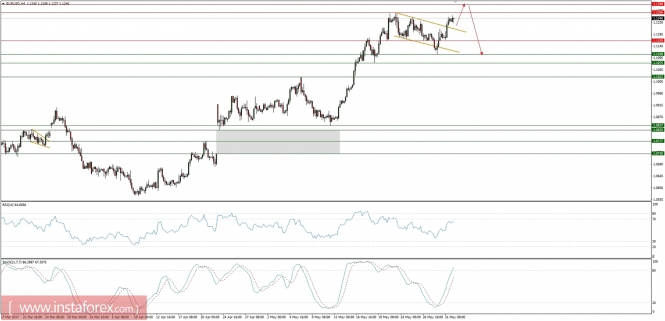
Let' now take a look at the EUR/USD technical picture on the H4 time frame. The bulls have managed to break out of the flag pattern, but the price is still trading below the important resistance at the level of 1.1266. A breakout higher will open the road to the level of 1.13000 and this might be the level of reversal because the momentum indicator shows little interest in the higher prices and the bearish divergence is forming. Only a way worse than expected data would send the EUR/USD pair soaring above the 1.1300 level toward the important technical resistance at the level of 1.1363.
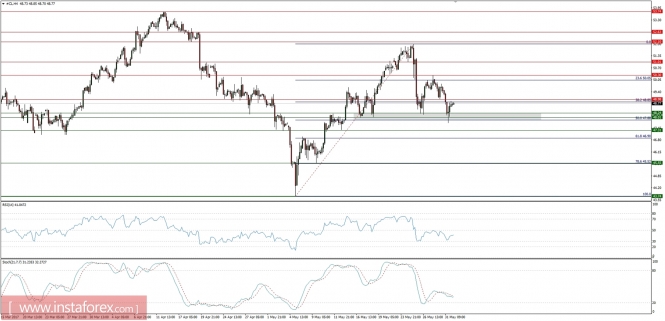
Market snapshot: Crude Oil bounce from 50% Fibo
The price of Crude Oil has bounced from the 50% Fibo at the level of $47.88, which creates strong support together with two technical levels at $48.01 and $48.24. The momentum indicator is showing a bullish divergence in this time frame, so a further rebound is expected. In order to rally, the price must breakout above the psychological level of $50.00, otherwise, it will get back to the range.