MG Network

something big isHappening!

In the mean time you can connect with us with via:

Copyright © Money Grows Network | Theme By Gooyaabi Templates

Money Grows Network

Archive

Powered by Blogger.

Welcome To Money Grows Network

Verified By

2006 - 2019 © www.moneygrows.net

Investments in financial products are subject to market risk. Some financial products, such as currency exchange, are highly speculative and any investment should only be done with risk capital. Prices rise and fall and past performance is no assurance of future performance. This website is an information site only.

Popular

Pages

Expert In

Name*


Message*

Ichimoku indicator analysis of gold for June 16, 2017

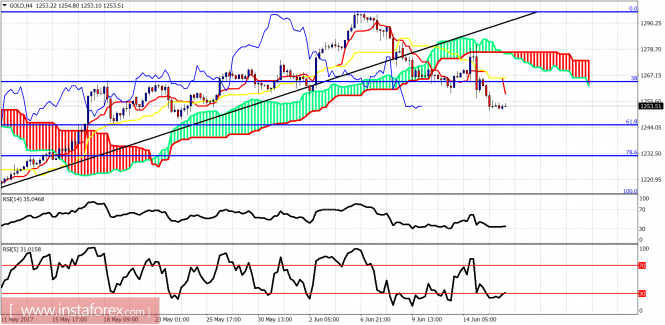
Gold price has reached the $1,250 area as we expected from $1,280 and higher. Trend is bearish. I believe that Gold weakness will continue and we might see even below $1,245 where important support is found. However Gold bears should be cautious as the time for a bullish reversal is approaching.

analytics5943810089beb.png

Gold price is trading below both the tenkan- and kijun-sen. There are some bullish divergence signs in the short-term. Price is below the 38% Fibonacci retracement. Price is expected to reach the 61.8% Fibonacci retracement towards $1,245. This is now the time to cover and take profits from any Gold short position.

analytics5943814c1b73f.jpg

Black line - long-term resistance trend line

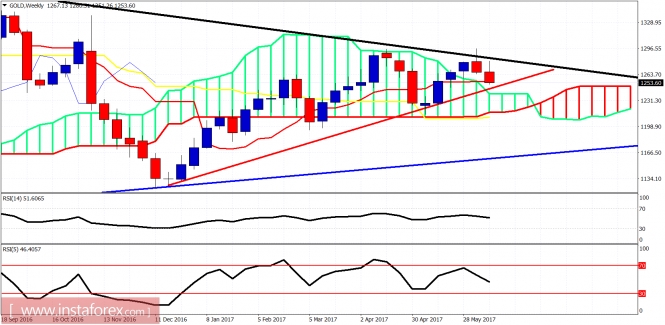
Red line - trend line support

Blue line - long-term support trend line

Gold price is approaching the red trend line support after being rejected at the black long-term trend line resistance. Price is above the weekly cloud. A bounce off the weekly Kumo at $1,245 will be a very bullish sign. As I have been saying last week, Gold was not ready for a big breakout. I believe the time for a big breakout has come closer and I remain longer-term bullish.

The material has been provided by InstaForex Company - www.instaforex.com