
Technical outlook:
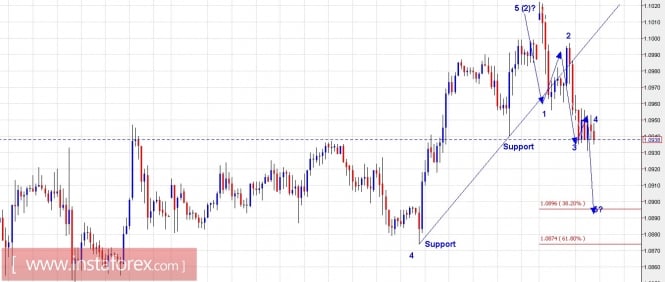
The EUR/USD pair finally seems to have formed a meaningful top today after gapping up in early hours but then reversing sharply lower. The pair is seen to be trading at 1.0937/38 levels for now, looking to a further push lower towards 1.0890/1.0900 levels today. If it does drop though the above-said levels, the wave count would suggest an impulsive drop complete on an hourly chat. The pair would be absolutely safe to be sold on rallies there after, with price being tapped below 1.1022 levels going forward. Please note that the top formed today could be wave (2) of a larger degree and that waves (3), (4) and (5) could resume lower from here on. The pair should be looking to resume a long-term bear trend and push prices lower toward parity levels in the coming weeks. Immediate support is seen at 1.0875 levels, while resistance is at 1.1022 levels respectively.
Trading plan:
Remain short and also look to sell intraday rallies, stop above 1.1022, the target is open. Please note this trading plan will take several weeks to unfold. The strategy would be to keep adding there.
GBPUSD chart setups:
Technical outlook:
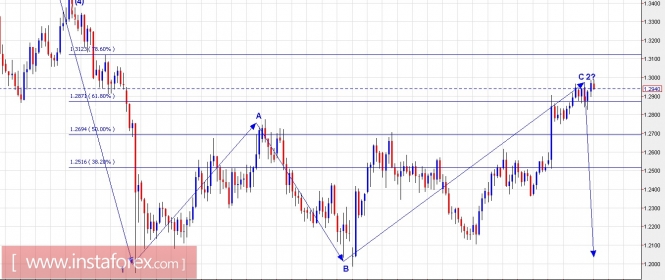
The GBP/USD pair looks to be finally topping out with the daily chart producing an engulfing bearish trade signal as seen here. The pair is trading at 1.2037 levels for now and seems to have completed wave 2 within 5-wave drop going forward. Please also note that fibonacci 0.618 resistance is also seen right within the vicinity of price action and to confirm a bearish reversal should be quite encouraging to bears going forward. The rally since October 2016 is still corrective (A-B-C). If this wave count holds to be true, the pair should unfold into 5 waves lower from here at least towards 1.1900 levels in the weeks to follow. On the flip side, a push through 1.2988 levels could print yet another high before resuming lower again. Immediate resistance is seen at 1.2988 levels, while support is at 1.2900 levels respectively.
Trading plan:
Flat for now, looking to sell on rallies.
Good luck!
The material has been provided by InstaForex Company - www.instaforex.com