Trading plan for 29/05/2017:
The Bank Holiday in China, UK, and the US will lead to low volatility trading today, so the financial markets oscillate around Friday close levels. Gold is trading inside of the range, while crude oil is declining slightly. The major and minor forex pairs have made marginal moves without any surprises. Stock indexes in Asia are drifting nearer to Friday's closing levels. The Nikkei is up 0.1% and the Shanghai Stock Exchange is closed.
On Monday 29th of May, the event calendar is bereft of any key news. However, there are two events that might bring some action to the market today: the Eurozone Money Supply data and the ECB President Mario Draghi speech about the economy and monetary developments before the Economic and Monetary Affairs Committee in Brussel.
Analysis of EUR/USD for 29/05/2017:
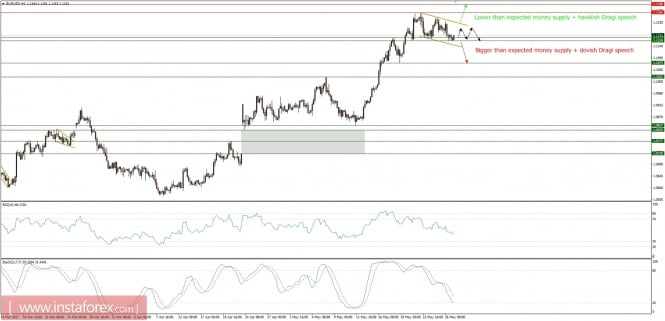
The Eurozone Money Supply data is scheduled for release at 08:00 am GMT and the ECB President Mario Draghi speech in Brussel is expected at around 02:00 pm GMT today. The general economic trend in the eurozone that started in the middle of 2016 is still expected to move higher at a steady pace. The recent estimates of the GDP growth rate in the second quarter were revised higher to 0.76% last Friday. The May was one of the most bullish months in the recent years, with the expansion of the business activity and high sentiment levels (highest in recorded history). The question remains, whether the upbeat outlook will soon convince the ECB to start winding down its extraordinary loose monetary policy. One of the first clues might come from today's monetary aggregates report. Market participants expect a slight dip in the broad measure of money supply (M3): a 5.2% year-on-year rate for April, down from March's 5.3%, but that's still close to the fastest pace in nearly a decade. This slight decrease in the money supply would reduce the likelihood of immediate interest rate hikes.
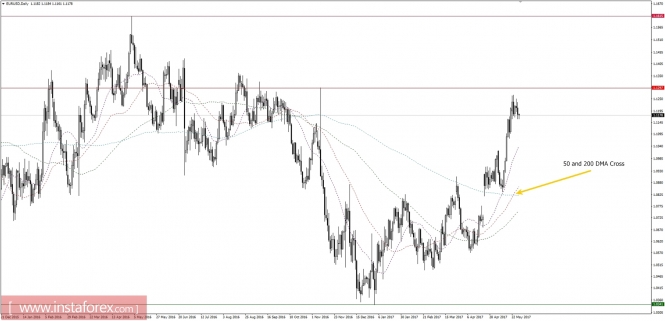
Let's now take a look at the EUR/USD technical picture on the daily and H4 timeframes. As we know, a larger money supply reduces the purchasing power of the euro and puts downward pressure on the exchange rate. Nevertheless, EUR/USD on the daily timeframe is still trading above all of the moving averages (21,50,100,200 periods). Moreover, recently 50 DMA has crossed over 200 DMA for the first time in eight weeks, which means the upside momentum remains intact. On the smaller timeframes, like H4, there is a corrective cycle expected, especially if the money supply data will not meet expectations. The next support is seen at the level of 1.1075 and the next technical resistance lies at 1.1266 and 1.1300.


Market Snapshot: Gold breaks above 61%Fibo
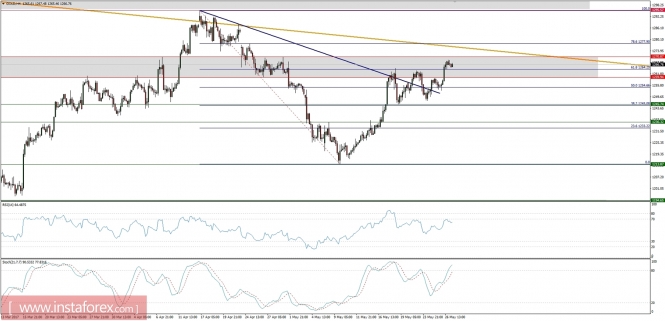
Gold has broken out above the 61%Fibo at the level of $1,264 and now the market is testing this level from below. This clearly outlines the direction of the trend, although it is worth waiting for the end of the correction in the first place. Another resistance for the bulls will be the 78% Fibo at the level of $1,278. Please notice that the price is still trapped between the the larger timeframe golden trend line resistance and the smaller timeframe navy trend line support. Moreover, the price still trades in the resistance area between the levels of $1,259 - 1,270.

Market Snapshot: Crude oil bounces from 50%Fibo
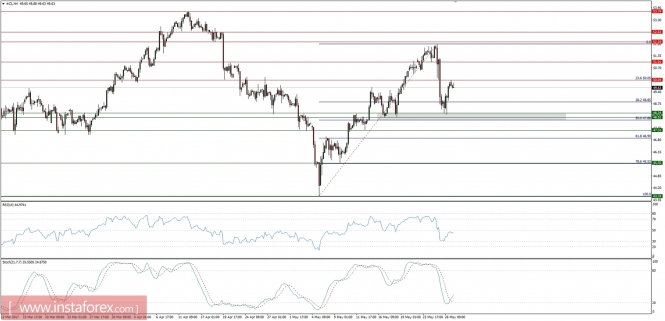
Crude oil prices have bounced from the 50%Fibo support zone around the level of $48.24 and now are trading just below the technical resistance at the level of $50.04. The market conditions look oversold, so there is a chance of a further move up towards the next technical resistance at $51.01. But in order to do this, the momentum indicator should raise above its fifty level. Any violation of the level of $52.00 will erase all the losses and bulls will likely continue to move towards the next swing high at the level of $53.74.

