
The index is extending losses below the 200 SMA on the H1 chart and is trying to invalidate the bullish outlook that we've been managing since last week. So far, USDX has been approaching the support level of 98.77, where a breakout should open the doors to test the 98.47 zone. However, as this move can be still considered as corrective, we can expect further rebounds to re-test the 200 SMA.
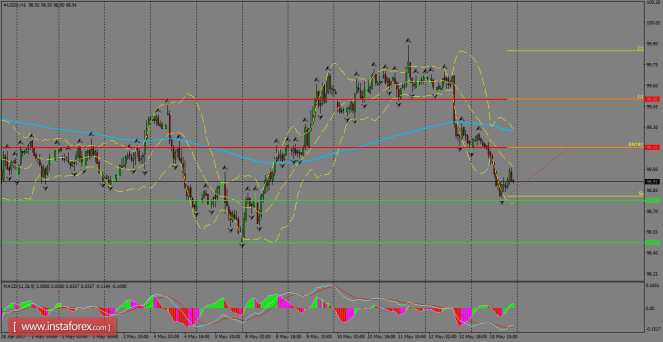
H1 chart's resistance levels: 99.15 / 99.50
H1 chart's support levels: 98.77 / 98.47
Trading recommendations for today: Based on the H1 chart, place buy (long) orders only if the USD index breaks with a bullish candlestick; the resistance level lies at 99.15, take profit is found at 99.50 and stop loss is at 98.81.
The material has been provided by InstaForex Company - www.instaforex.com