
GBP/USD bulls lost momentum after reaching the resistance zone of 1.3038 and it seems that a consolidation is in place with a possibility to re-test the 200 SMA on H1 chart. However, the overall picture remains modestly bullish, despite the fact there are no new bullish patterns' formations across the board. MACD indicator is turning to the negative territory, favoring to the downside scenario in the short term.
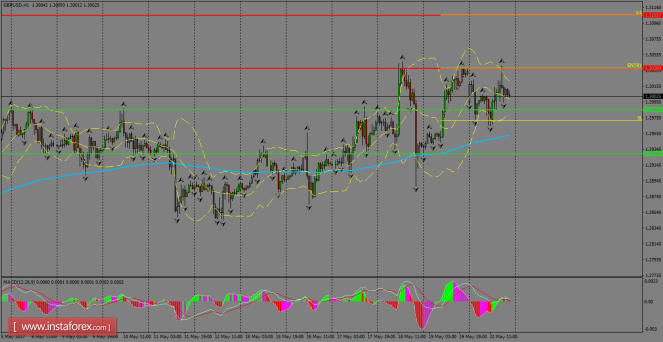
H1 chart's resistance levels: 1.3038 / 1.3105
H1 chart's support levels: 1.2984 / 1.2928
Trading recommendations for today: Based on the H1 chart, buy (long) orders only if the GBP/USD pair breaks a bullish candlestick; the resistance level is at 1.3038, take profit is at 1.3105 and stop loss is at 1.2970.
The material has been provided by InstaForex Company - www.instaforex.com