
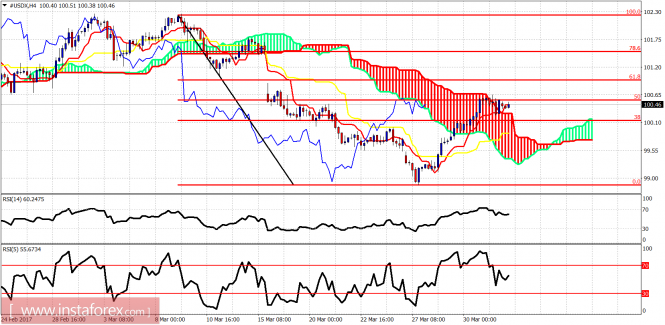
The Dollar index continued its bounce higher on Friday after the selling pressures in its main component the EUR/USD pair. Trend remains bullish in the short term as long as the price is trading above 100.20. There are signs of a correction coming. The next pullback will be very important.
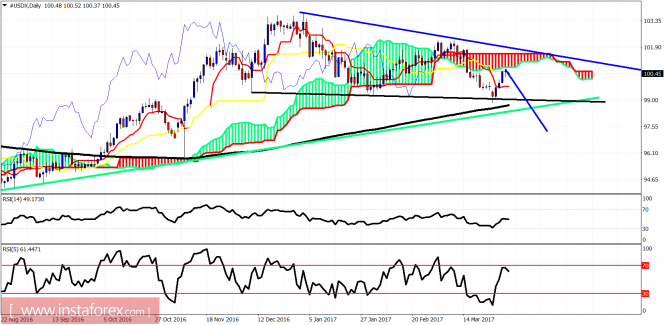
Black line - neckline support
Green line - long-term trend line support
The Dollar index is bouncing towards the Ichimoku cloud in the daily chart. The 100.80 level is important daily resistance. A rejection here and a lower high will be a bearish signal frontrunning another selling pressure to push the index below the black neckline support. Another break below the black neckline support will be a very bearish sign. Breaking the green trend line support will also be a bearish sign. On the other hand, the bulls need to break above 101.80-102 price area in order to strengthen the bullish scenario.
The material has been provided by InstaForex Company - www.instaforex.comfrom www.instaforex.com https://www.instaforex.com/forex_analysis/90031/?x=BPDZ
via IFTTT