
Gold price has reached important long-term resistance and could make a deeper than normal pull back from current levels. We pay close attention to the short-term support levels as a swift breakdown could start any minute. Overall, my longer-term view remains bullish.
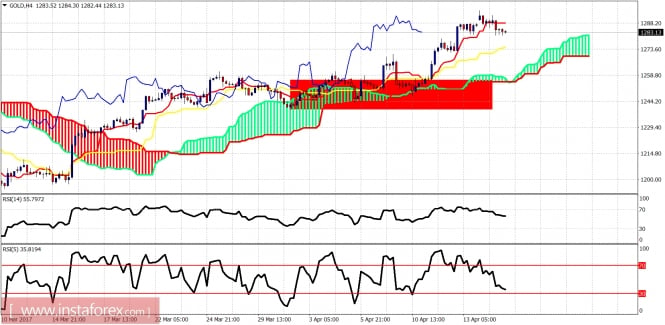
Red rectangle area - support
Gold price is trading above the Kumo (cloud) and between the Tenkan- and Kijun-sen indicators. Short-term support is found at the Kijun-sen (yellow line indicator) at $1,273. Resistance is at $1,288. If gold makes a shallow pullback, I expect $1,270 to hold. If gold makes a deeper pullback, I expect to see it near $1,250-40.
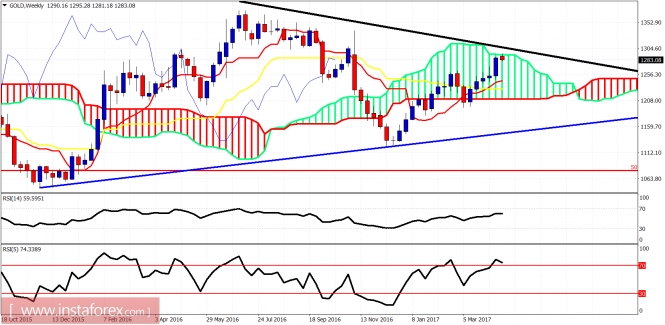
Blue line - long-term support
Gold price is trying to break above the weekly Kumo (cloud) and the black downward sloping trend line resistance. A break above both of them will be a confirmation of my longer-term bullish view for gold. However, firstly we may see a rejection around $1,290-$1,300 back towards $1,250-$1,220.
The material has been provided by InstaForex Company - www.instaforex.com